Concept explainers
Videos
Consider the following pH curves for 100.0 mL of two different acids with the same initial concentration each titrated by 0.10 M NaOH.
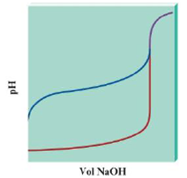
a. Which plot represents a pH curve of a weak acid, and which plot is for a strong acid? How can you tell? Cite three differences between the plots that help you decide.
b. In both cases the pH is relatively constant before the pH changes greatly. Does this mean that at some point in each titration each solution was a buffered solution?
c. True or false? The equivalence point volume for each titration is the same. Explain your answer.
d. True or false? The pH at the equivalence point for each titration is the same. Explain your answer.

Trending nowThis is a popular solution!

Chapter 15 Solutions
Chemistry
Additional Science Textbook Solutions
Living By Chemistry: First Edition Textbook
Chemistry: A Molecular Approach
Principles of Chemistry: A Molecular Approach (3rd Edition)
General Chemistry: Atoms First
Organic Chemistry
Organic Chemistry (8th Edition)


- The titration curves for two acids with the same base are shown on this graph. (a) Which is the curve for the weaker acid? Explain your choice. (b) Give the approximate pH at the equivalence point for the titration of each acid. (c) Explain why the pH at the equivalence point differs for each acid. (d) Explain why the starting pH values of the two acids differ. (e) Which indicator or indicators, phenolphthalein, bromthymol blue, or methyl red, could be used for the titration of Acid 1? For the titration of Acid 2? Explain your choices.arrow_forwardConsider the nanoscale-level representations for Question 110 of the titration of the aqueous weak acid HX with aqueous NaOH, the titrant. Water molecules and Na+ ions are omitted for clarity. Which diagram corresponds to the situation: After a very small volume of titrant has been added to the initial HX solution? When enough titrant has been added to take the solution just past the equivalence point? Halfway to the equivalence point? At the equivalence point? Nanoscale representations for Question 110.arrow_forwardEach of the solutions in the table has the same volume and the same concentration, 0.1 M. Which solution requires the greatest volume of 0.1-M NaOH to titrate to the equivalence point? Explain your answer.arrow_forward
- A 0.2481 M solution of KOH is used to titrate 30.00 mL of 0.269 M hydrobromic acid. Assume that volumes are additive. (a) Write a balanced net ionic equation for the reaction that takes place during the titration. (b) What are the species present at the equivalence point? (c) What volume of KOH is required to reach the equivalence point? (d) What is the pH of the solution 1. before any KOH is added? 2. halfway to the equivalence point? 3. at the equivalence point?arrow_forwardYou are given the following acidbase titration data, where each point on the graph represents the pH after adding a given volume of titrant (the substance being added during the titration). a What substance is being titrated, a strong acid, strong base, weak acid, or weak base? b What is the pH at the equivalence point of the tiration? c What indicator might you use to perform this titration? Explain.arrow_forward2. In the titration of a 25 mL of 0.245 M weak base being titrated by 0.365 M HCI determine, the Kp for the weak base is 8.30 x 10-s: a. The pH at the initial point. b. The pH after 12.3 mL of HCl has been added. pH c. The pH at the equivalence point. pH d. The pH after 18.4 mL of HCl has been added. pH pHarrow_forward
- 2. Calculate the pH at each stage in the titration for the addition of 0.110 M HCL to 35.0 mL of 0.105 M NAOH. a. Initiallyb. after the addition of 5.00mL of acid c. after the addition of a further 5.00mL of acid (10.00mL total of acid)d. at the equivalence point.e. after the addition of 5.00 of acid beyond the equivalence point.f. after the addition of 10.0mL of acid beyond the equivalence pointg. on graph paper draw the curve of pH vs mL of acid. First plot, the points from a through f and then sketch the curve.arrow_forward4. A 30.0 mL sample of 0.135 M aqueous benzoic acid is titrated with 0.115 M aqueous potassium hydroxide. d. calculate the pH at the point halfway to the equivalence point. e. what volume of potassium hydroxide solution is required to reach the equivalence point? (see (c)) f. calculate the pH at the equivalence point. g. calculate the pH of the solution when an additional 5.0 mL of potassium hydroxide has been added; that is, 5.00 mL in addition to the amount required to reach the equivalence point.arrow_forward1. A pH change of 0.2 units requires the addition of 0.05 mL of NaOH. You are probably at what point in the titration? a. very close to equivalence point b. after equivalence point c. either before or after the equivalence point d. before equivalence point 2. A pH change of 0.2 units requires the addition of 1.50 mL of NaOH. You are probably at what point in the titration? a. after equivalence point b. either beforeor after the equivalence point c. very close to equivalence point d. before the equivalence point 3. Looking at the graph provided, which of the following indicators could be used to find the equivalence point for this titration the conventional way? Select all that apply. a. methyl orange (turns red to yellow from a pH of 3.1 to 4.4) b. methyl red (turns red to yellow from a pH of 4.2 to 6.3) c. cresol red (turns yellow to red from a pH of 7.2 to 8.8) d. thymol blue (turns yellow to red form a pH of 8.0 to 9.6) e. phenolphthalein (turns colorless to dark pink from a pH of…arrow_forward
- Given the titration curve of a weak acid, at which region is the buffer capacity considered maximized? IV II pH II volume of OH- added Select one: O a. Region I, because there is no strong base added O b. Region II, because there is almost equal amounts of weak acid and conjugate base O c. Region III, because it is the equivalence point, where equal amount of base is added to the weak acid O d. Region IV, because the buffer can easily neutralize acid or base at this pointarrow_forward4. A 30.0 mL sample of 0.135 M aqueous benzoic acid is titrated with 0.115 M aqueous potassium hydroxide. g. calculate the pH of the solution when an additional 5.0 mL of potassium hydroxide has been added; that is, 5.00 mL in addition to the amount required to reach the equivalence point. h. generate a curve of pH vs. mL potassium hydroxide. polt the point from (a) through (f) and then sketch the curve. those are the remaining parts.arrow_forwardAnswer the following questions about preparing the same buffer solution using three different methods. All three buffers are to have a pH of 9.00. Be sure to show your logic clearly and with all steps in the calculation. a. Given two separate solutions, 0.100 M ammonia and 0.100 M ammonium chloride, calculate the volume of each solution required to form 60.0 mL of a mixture that has the desired pH. b. Calculate the amount of solid NH4Cl to add to 60.0 mL of 0.100 M ammonia to form a mixture that has the desired pH. Assume no volume change in the solution. Hint: Use the same buffer ratio that you used in (a). c. Calculate the volume of 0.100 M HCl that is required to react with 50.0 mL of 0.100 M ammonia to form a mixture that has the desired pH. Hint: think of this as a titration problem. Unlike (a) and (b), there IS a reaction between acid and base.arrow_forward
 ChemistryChemistryISBN:9781305957404Author:Steven S. Zumdahl, Susan A. Zumdahl, Donald J. DeCostePublisher:Cengage Learning
 Chemistry: An Atoms First ApproachChemistryISBN:9781305079243Author:Steven S. Zumdahl, Susan A. ZumdahlPublisher:Cengage Learning
 General Chemistry - Standalone book (MindTap Cour...ChemistryISBN:9781305580343Author:Steven D. Gammon, Ebbing, Darrell Ebbing, Steven D., Darrell; Gammon, Darrell Ebbing; Steven D. Gammon, Darrell D.; Gammon, Ebbing; Steven D. Gammon; DarrellPublisher:Cengage Learning
 Chemistry: Principles and ReactionsChemistryISBN:9781305079373Author:William L. Masterton, Cecile N. HurleyPublisher:Cengage Learning
 Chemistry: The Molecular ScienceChemistryISBN:9781285199047Author:John W. Moore, Conrad L. StanitskiPublisher:Cengage Learning