
Videos
The population center of the 48 contiguous states of the United States is the point where a flat, rigid map of the contiguous states would balance if the location of each person was represented on the map by a weight of equal measure. In 1790, the population center was 23 miles east of Baltimore, Maryland. By 1990, the center had shifted about 800 miles west and 100 miles south to a point in southeast Missouri. To study this shifting population, the U.S. Census Bureau divides the states into four regions as shown in the figure. Problems 69 and 70 deal with population shifts among these regions.
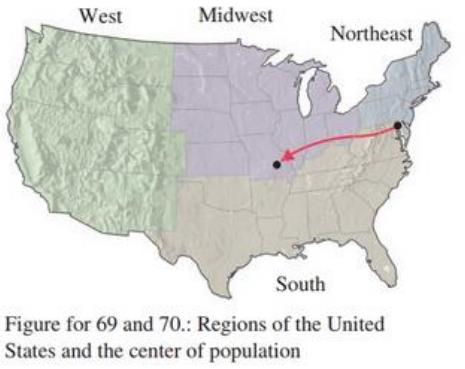
Population shifts. Table 3 gives the percentage of the U.S. population living in the south region during the indicated years.
The following transition matrix
(A) Let
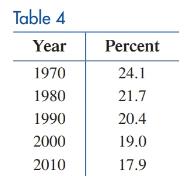
(B) Construct a new table comparing the results from part (A) with the data in Table 4.
(C) According to this transition matrix, what percentage of the population will live in the northeast region in the long run?
Want to see the full answer?
Check out a sample textbook solution
Chapter 9 Solutions
Finite Mathematics for Business, Economics, Life Sciences and Social Sciences
Additional Math Textbook Solutions
Calculus for Business, Economics, Life Sciences, and Social Sciences (13th Edition)
Mathematics with Applications In the Management, Natural and Social Sciences (11th Edition)
A Problem Solving Approach to Mathematics for Elementary School Teachers (12th Edition)
Mathematics All Around (6th Edition)
Using & Understanding Mathematics: A Quantitative Reasoning Approach (7th Edition)
Excursions in Modern Mathematics (9th Edition)


- Determine the overall length, width, and height of the in Figure 2-4. All dimensions are in inches. length = ______. width =______. height =______.arrow_forwardThe height of bedridden patients is often estimated from the length of the patient's ulna, the distance between the point on the elbow and the prominent bone on the wrist. Eight men over the age of 65 had both their height (in centimeters) and the length of their ulna (in centimeters) measured. The data are given in the table below. Ulna length (cm) 20 23 24 26 27 29 30 31 Height (cm) 160 163 166 168 171 178 182 186 Let x denote a patient's ulna length (in cm) and y denote the patient's height (in cm). Assume that the population distributions for both ulna length and height are approximately normal. The following summary measures were obtained from the data. X = 26.25, ỹ = 171.75, SSxx = 99.5, SSyy= 609.5, SSxy= 238.5 ху We wish to find the least squares regression line for the data in this table using ulna length as an independent variable and height as a dependent variable. Estimate the y-intercept of the least squares regression line. Enter your answer using three decimal places.arrow_forwardThe height of bedridden patients is often estimated from the length of the patient's ulna, the distance between the point on the elbow and the prominent bone on the wrist. Eight men over the age of 65 had both their height (in centimeters) and the length of their ulna (in centimeters) measured. The data are given in the table below. Ulna length (cm) 20 23 24 26 27 29 30 31 Height (cm) 160 163 166 168 171 178 182 186 Let x denote a patient's ulna length (in cm) and y denote the patient's height (in cm). Assume that the population distributions for both ulna length and height are approximately normal. The following summary measures were obtained from the data. X = 26.25, ỹ = 171.75, SSxx = 99.5, SSyy= 609.5, SSxy= 238.5 ху We wish to find the least squares regression line for the data in this table using ulna length as an independent variable and height as a dependent variable. Use the information to estimate the slope of the least squares regression line. Enter your answer using three…arrow_forward
- When an anthropologist finds skeletal remains, they need to figure out the height of the person. The height of a person (in cm) and the length of their metacarpal bone (in cm) were collected for 18 sets of skeletal remains. The data are in the table below. X, length of metacarpal (in cm) Y, height (in cm) 51 180 45 173 47 175 42 165 44 171 40 163 42 175 44 173 39 159 45 173 46 175 52 176 50 181 50 178 49 170 46 173 38 157 49 185 a) State the random variables. rv X = of rv Y = of b) Make a scatterplot of X versus Y in StatCrunch (optional). Why do we wish to sketch a scatterplot? c) Find the equation of the best-fitting line (the least squares regression equation). Round values to 2 decimal places. Include the restricted domain. equation: = + * X restricted domain: cm <= X <= cm d) Interpret the slope from part c in the context of this problem. (Pay…arrow_forwardan effect size of .17 would be consideredarrow_forwardA map has a scale of 0.5 inch miles. How far apart would two cities be 75 %3D on the map if they are actually 225 miles аpart? A. 1.5 inches B. 2.0 inches C. 3.0 inches D. 4.5 inchesarrow_forward
- The area of sector?arrow_forwardPyramid Lake, Nevada, is described as the pride of the Paiute Indian Nation. It is a beautiful desert lake famous for very large trout. The elevation of the lake surface (feet above sea level) varies according to the annual flow of the Truckee River from Lake Tahoe. Assume that the U.S. Geological Survey provided the following data: Year 1986 1987 1988 1989 1990 1991 1992 1993 Elevation 3817 3815 3810 3812 3808 3803 3798 3797 Year 1994 1995 1996 1997 1998 1999 2000 Elevation 3795 3797 3802 3807 3811 3816 3817 Make a time series graph.arrow_forwardB. Present the following data in Tabular Form. Stat Mountain Bike Shop has sold 50 bicycles the month of January. Similarly, in the month of February 60 bicycles were sold. While in March the sales go down to 45 and 30 in May.arrow_forward
- fice.com/Pages/ResponsePage.aspx?id%3DyThYlrNzAkqG6qV580BFzuu3K045ESFlgAMQ1nBhVxJUM0w5NU1... so 19 Question The cost of traveling varies directly as the distance traveled. If it costs $2,240 to fly from California to Hawaii (2,200 miles), how much would it cost to fly a distance of 4,000 miles from California to Peru? A) $3,852.18 B) $4,072.73 C) $4,285.17 D) $3,928.57 O Aarrow_forwardApply table to question.arrow_forwardA reseacher desires to know if the age of a child is related to the number of cavities he or she has.arrow_forward
 Algebra: Structure And Method, Book 1AlgebraISBN:9780395977224Author:Richard G. Brown, Mary P. Dolciani, Robert H. Sorgenfrey, William L. ColePublisher:McDougal Littell
 Mathematics For Machine TechnologyAdvanced MathISBN:9781337798310Author:Peterson, John.Publisher:Cengage Learning,
 Holt Mcdougal Larson Pre-algebra: Student Edition...AlgebraISBN:9780547587776Author:HOLT MCDOUGALPublisher:HOLT MCDOUGAL
 Glencoe Algebra 1, Student Edition, 9780079039897...AlgebraISBN:9780079039897Author:CarterPublisher:McGraw Hill