
Survey of Accounting (Accounting I)
8th Edition
ISBN: 9781305961883
Author: Carl Warren
Publisher: Cengage Learning
expand_more
expand_more
format_list_bulleted
Videos
Textbook Question
Chapter 9, Problem 9.5.2C
Comprehensive profitability and solvency analysis
Starwood Hotels & Resorts Worldwide Inc. (HOT)
and Wyndham Worldwide Corporation (WYN)
are two major owners and managers of lodging and resort properties in the United States. Financial data (in millions) for a recent year for the two companies are as follows:
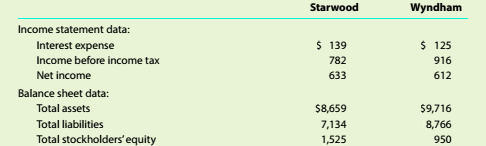
The average liabilities,
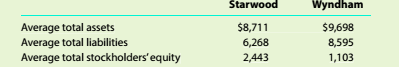
Analyze and compare the two companies, using the information in (1).
Expert Solution & Answer
Want to see the full answer?
Check out a sample textbook solution
Students have asked these similar questions
Marriott International, Inc., and Hyatt Hotels Corporation are two major owners and managers of lodging and resort properties in the United States. Abstracted income statement information for the two companies is as follows for a recent year (in millions):Please see the attachment for details:1. Determine the following ratios for both companies, rounding ratios and percentages to one decimal place:a. Return on total assetsb. Return on stockholders’ equityc. Times interest earnedd. Ratio of total liabilities to stockholders’ equity2. Based on the information in (1), analyze and compare the two companies’ solvency and profitability.
Profitability ratios help in the analysis of the combined impact of liquidity ratios, asset management ratios, and debt management ratios on the
operating performance of a firm.
Your boss has asked you to calculate the profitability ratios of Petroxy Oil Co. and make comments on its second-year performance as compared with
its first-year performance.
The following shows Petroxy Oll Co.'s Income statement for the last two years. The company had assets of $9,400 million in the first year and $15,037
million in the second year. Common equity was equal to $5,000 million in the first year, and the company distributed 100% of its earnings out as
dividends during the first and the second years. In addition, the firm did not issue new stock during either year.
Petroxy Oil Co. Income Statement For the Year Ending on December 31 (Millions of dollars)
Year 2 Year 1
4,000
1,268
Net Sales
Operating costs except depreciation and amortization
Depreciation and amortization
Total Operating Costs…
5. Profitability ratios
Profitability ratios help in the analysis of the combined impact of liquidity ratios, asset management ratios, and debt management ratios on the
operating performance of a firm.
Your boss has asked you to calculate the profitability ratios of Diusitech Inc. and make comments on its second-year performance as compared with its
first-year performance.
The following shows Diusitech Inc.'s income statement for the last two years. The company had assets of $4,700 million in the first year and $7,518
million in the second year. Common equity was equal to $2,500 million in the first year, and the company distributed 100% of its earnings out as
dividends during the first and the second years. In addition, the firm did not issue new stock during either year.
Diusitech Inc. Income Statement For the Year Ending on December 31 (Millions of dollars)
Year 2 Year 1
2,540
2,000
1,610
1,495
127
80
1,737
803
80
723
181
542
Net Sales
Operating costs except depreciation and…
Chapter 9 Solutions
Survey of Accounting (Accounting I)
Ch. 9 - What type of analysis is indicated by the...Ch. 9 - Which of the following measures indicates the...Ch. 9 - Prob. 3SEQCh. 9 - Prob. 4SEQCh. 9 - Prob. 5SEQCh. 9 - That is the difference between horizontal and...Ch. 9 - Prob. 2CDQCh. 9 - Prob. 3CDQCh. 9 - Prob. 4CDQCh. 9 - How would the current and quick ratios of a...
Ch. 9 - For Belzcr Corporation, the working capital at the...Ch. 9 - Prob. 7CDQCh. 9 - Prob. 8CDQCh. 9 - a. Why is it advantageous to have a high inventory...Ch. 9 - Prob. 10CDQCh. 9 - Prob. 11CDQCh. 9 - Prob. 12CDQCh. 9 - Prob. 13CDQCh. 9 - Prob. 14CDQCh. 9 - Prob. 15CDQCh. 9 - Favorable business conditions may bring about...Ch. 9 - Prob. 17CDQCh. 9 - Prob. 9.1ECh. 9 - Vertical analysis of income statement The...Ch. 9 - Common-sized income statement Revenue and expense...Ch. 9 - Prob. 9.4ECh. 9 - Prob. 9.5ECh. 9 - Prob. 9.6ECh. 9 - Prob. 9.7ECh. 9 - Current position analysis The bond indenture for...Ch. 9 - Accounts receivable analysis The following data...Ch. 9 - Prob. 9.10ECh. 9 - Inventory analysis The following data were...Ch. 9 - Inventory analysis Costco Wholesale Corporation...Ch. 9 - Ratio of liabilities to stockholders' equity and...Ch. 9 - Prob. 9.14ECh. 9 - Debt ratio, ratio of liabilities to stockholders'...Ch. 9 - Prob. 9.16ECh. 9 - Profitability metrics The following selected data...Ch. 9 - Profitability metrics Macy's, Inc. (M). sells...Ch. 9 - Seven metrics The following data were taken from...Ch. 9 - Prob. 9.20ECh. 9 - Prob. 9.21ECh. 9 - Prob. 9.22ECh. 9 - Unusual income statement items Assume that the...Ch. 9 - Horizontal analysis for income statement For 20Y3....Ch. 9 - Horizontal analysis for income statement For 20Y3....Ch. 9 - Prob. 9.2.1PCh. 9 - Prob. 9.2.2PCh. 9 - Effect of transactions on current position...Ch. 9 - Effect of transactions on current position...Ch. 9 - Twenty metrics of liquidity, solvency, and...Ch. 9 - Twenty metrics of liquidity, solvency, and...Ch. 9 - Twenty metrics of liquidity, solvency, and...Ch. 9 - Twenty metrics of liquidity, solvency, and...Ch. 9 - Twenty metrics of liquidity, solvency, and...Ch. 9 - Twenty metrics of liquidity, solvency, and...Ch. 9 - Prob. 9.4.7PCh. 9 - Twenty metrics of liquidity, solvency, and...Ch. 9 - Twenty metrics of liquidity, solvency, and...Ch. 9 - Twenty metrics of liquidity, solvency, and...Ch. 9 - Twenty metrics of liquidity, solvency, and...Ch. 9 - Twenty metrics of liquidity, solvency, and...Ch. 9 - Twenty metrics of liquidity, solvency, and...Ch. 9 - Twenty metrics of liquidity, solvency, and...Ch. 9 - Twenty metrics of liquidity, solvency, and...Ch. 9 - Twenty metrics of liquidity, solvency, and...Ch. 9 - Twenty metrics of liquidity, solvency, and...Ch. 9 - Twenty metrics of liquidity, solvency, and...Ch. 9 - Twenty metrics of liquidity, solvency, and...Ch. 9 - Prob. 9.4.20PCh. 9 - Trend analysis Critelli Company has provided the...Ch. 9 - Trend analysis Critelli Company has provided the...Ch. 9 - Prob. 9.1CCh. 9 - Prob. 9.2CCh. 9 - Prob. 9.3CCh. 9 - Prob. 9.4.1CCh. 9 - Prob. 9.4.2CCh. 9 - Prob. 9.4.3CCh. 9 - Comprehensive profitability and solvency analysis...Ch. 9 - Comprehensive profitability and solvency analysis...
Knowledge Booster


Learn more about
Need a deep-dive on the concept behind this application? Look no further. Learn more about this topic, accounting and related others by exploring similar questions and additional content below.Similar questions
- Analyze and compare Bank of America and Wells Fargo Bank of America Corporation (BAC) and Wells Fargo Company (WFC) are two large financial services companies. The following data (in millions) were taken from a recent years financial statements for both companies: a. Compute the earnings per share for both companies. Round to the nearest cent. a. Which company appears to be more profitable on an earnings-per-share basis? b. Which company would you expect to have the larger quoted market price?arrow_forwardMike Sanders is considering the purchase of Kepler Company, a firm specializing in the manufacture of office supplies. To be able to assess the financial capabilities of the company, Mike has been given the companys financial statements for the 2 most recent years. Required: Note: Round all answers to two decimal places. 1. Compute the following for each year: (a) return on assets, (b) return on stockholders equity, (c) earnings per share, (d) price-earnings ratio, (e) dividend yield, and (f ) dividend payout ratio. 2. CONCEPTUAL CONNECTION Based on the analysis in Requirement 1, would you invest in the common stock of Kepler?arrow_forwardProfitability ratios help in the analysis of the combined impact of liquidity ratios, asset management ratios, and debt management ratios on the operating performance of a firm. Your boss has asked you to calculate the profitability ratios of Spandust Industries Inc. and make comments on its second-year performance as compared with its first-year performance. The following shows Spandust Industries Inc.’s income statement for the last two years. The company had assets of $7,050 million in the first year and $11,278 million in the second year. Common equity was equal to $3,750 million in the first year, and the company distributed 100% of its earnings out as dividends during the first and the second years. In addition, the firm did not issue new stock during either year. Spandust Industries Inc. Income Statement For the Year Ending on December 31 (Millions of dollars) Year 2 Year 1 Net Sales 3,810 3,000 Operating costs except depreciation and amortization 1,855 1,723…arrow_forward
- Profitability ratios help in the analysis of the combined impact of liquidity ratios, asset management ratios, and debt management ratios on the operating performance of a firm. Your boss has asked you to calculate the profitability ratios of Diusitech Inc. and make comments on its second-year performance as compared with its first-year performance. The following shows Diusitech Inc.'s income statement for the last two years. The company had assets of $8,225 million in the first year and $13,157 million in the second year. Common equity was equal to $4,375 million in the first year, and the company distributed 100% of its earnings out as dividends during the first and the second years. In addition, the firm did not issue new stock during either year. Diusitech Inc. Income Statement For the Year Ending on December 31 (Millions of dollars) Year 2 Year 1 4,445 1,120 222 1,342 3,103 310 2,793 698 2,095 Net Sales Operating costs except depreciation and amortization Depreciation and…arrow_forwardProfitability ratios help in the analysis of the combined impact of liquidity ratios, asset management ratios, and debt management ratios on the operating performance of a firm. Your boss has asked you to calculate the profitability ratios of Diusitech Inc. and make comments on its second-year performance as compared with its first-year performance. The following shows Diusitech Inc.’s income statement for the last two years. The company had assets of $10,575 million in the first year and $16,916 million in the second year. Common equity was equal to $5,625 million in the first year, and the company distributed 100% of its earnings out as dividends during the first and the second years. In addition, the firm did not issue new stock during either year. Diusitech Inc. Income Statement For the Year Ending on December 31 (Millions of dollars) Year 2 Year 1 Net Sales 5,715 4,500 Operating costs except depreciation and amortization 1,365 1,268 Depreciation and…arrow_forwardProfitability ratios help in the analysis of the combined impact of liquidity ratios, asset management ratios, and debt management ratios on the operating performance of a firm. Your boss has asked you to calculate the profitability ratios of Petroxy Oil Co. and make comments on its second-year performance as compared with its first-year performance. The following shows Petroxy Oil Co.’s income statement for the last two years. The company had assets of $4,700 million in the first year and $7,518 million in the second year. Common equity was equal to $2,500 million in the first year, and the company distributed 100% of its earnings out as dividends during the first and the second years. In addition, the firm did not issue new stock during either year. Petroxy Oil Co. Income Statement For the Year Ending on December 31 (Millions of dollars) Year 2 Year 1 Net Sales 2,540 2,000 Operating costs except depreciation and amortization 1,610 1,495 Depreciation and…arrow_forward
- Profitability ratios help in the analysis of the combined impact of liquidity ratios, asset management ratios, and debt management ratios on the operating performance of a firm. Your boss has asked you to calculate the profitability ratios of St. McStanky Beer Co. and make comments on its second-year performance as compared with its first-year performance. The following shows St. McStanky Beer Co.'s income statement for the last two years. The company had assets of $3,525 million in the first year and $5,639 million in the second year. Common equity was equal to $1,875 million in the first year, and the company distributed 100% of its earnings out as dividends during the first and the second years. In addition, the firm did not issue new stock during either year. St. McStanky Beer Co. Income Statement For the Year Ending on ecember 31 (Millions of dollars) Year 2 Year 1 1,905 1,500 1,610 1,495 60 1,555 Net Sales Operating costs except depreciation and amortization Depreciation and…arrow_forwardProfitability ratios help in the analysis of the combined impact of liquidity ratios, asset management ratios, and debt management ratios on the operating performance of a firm. Your boss has asked you to calculate the profitability ratios of Dernham Inc. and make comments on its second-year performance as compared with its first-year performance. The following shows Dernham Inc. ’s income statement for the last two years. The company had assets of $3,525 million in the first year and $5,639 million in the second year. Common equity was equal to $1,875 million in the first year, and the company distributed 100% of its earnings out as dividends during the first and the second years. In addition, the firm did not issue new stock during either year. Dernham Inc. Income Statement For the Year Ending on December 31 (Millions of dollars) Year 2 Year 1 Net Sales 1,905 1,500 Operating costs except depreciation and amortization 1,855 1,723 Depreciation and amortization 95 60…arrow_forwardDuPont system of analysis Use the following financial information for AT&T and Verizon to conduct a DuPont system of analysis for each company. Sales Earnings available for common stockholders Total assets Stockholders' equity a. Which company has the higher net profit margin? Higher asset turnover? b. Which company has the higher ROA? The higher ROE? c. Which company has the higher financial leverage multiplier? a. Net profit margin (Round to three decimal places.) AT&T Net profit margin AT&T $164,000 13,333 403,921 201,934 Verizon Verizon $126,280 13,608 244,280 24,232arrow_forward
- Compute the following profitability ratios of the company for the most recent two years, show all values in the computations: 1.Asset Turnover 2.Profit margin ratio(Net Income/Net Sales) 3.Return on total assets (Net Income/Average Total Assets) 4.Return on stockholders’ equity 5.Basic Earnings per share (EPS) Based on the results above, what conclusions can you make about the company’s overall profitability and efficient use of assets?arrow_forwardSolvency and Profitability Trend Analysis (Graph Picture from A-D is on the buttom for references) Addai Company has provided the following comparative information: 20Y8 20Y7 20Y6 20Y5 20Y4 Net income $273,406 $367,976 $631,176 $884,000 $800,000 Interest expense 616,047 572,003 528,165 495,000 440,000 Income tax expense 31,749 53,560 106,720 160,000 200,000 Total assets (ending balance) 4,417,178 4,124,350 3,732,443 3,338,500 2,750,000 Total stockholders’ equity (ending balance) 3,706,557 3,433,152 3,065,176 2,434,000 1,550,000 Average total assets 4,270,764 3,928,396 3,535,472 3,044,250 2,475,000 Average total stockholders' equity 3,569,855 3,249,164 2,749,588 1,992,000 1,150,000 You have been asked to evaluate…arrow_forwardAnalyze and compare Marriott and Hyatt Marriott International, Inc. (MAR), and Hyatt Hotels Corporation (H) are two major ovwners and managers of lodging and resort properties in the United States. Abstracted income statement information for the two companies is as follows for a recent year (in millions): Marriott Hyatt Operating profit before other revenue and interest $1,368 $299 Other revenue (expense) 50 66 Interest expense (234) (76) Income before income tax expense $1,184 $289 Income tax expense (404) (85) Net income $ 780 $204 Balance sheet information is as follows: Marriott Нyatt Total liabilities Total stockholders' equity $18,783 $ 3,841 5,357 3,908 Total liabilities and stockholders' equity $24,140 $ 7,749 The average liabilities, average stockholders' equity, and average total assets are as follows: Marriott Нyatt Average total liabilities $14,228 $3,719 Average total stockholders' equity Average total assets 883 3,951 15,111 7,670 1. Calculate the following ratios for…arrow_forward
arrow_back_ios
SEE MORE QUESTIONS
arrow_forward_ios
Recommended textbooks for you
 Survey of Accounting (Accounting I)AccountingISBN:9781305961883Author:Carl WarrenPublisher:Cengage Learning
 Managerial AccountingAccountingISBN:9781337912020Author:Carl Warren, Ph.d. Cma William B. TaylerPublisher:South-Western College Pub
 Financial AccountingAccountingISBN:9781337272124Author:Carl Warren, James M. Reeve, Jonathan DuchacPublisher:Cengage Learning
 Managerial Accounting: The Cornerstone of Busines...AccountingISBN:9781337115773Author:Maryanne M. Mowen, Don R. Hansen, Dan L. HeitgerPublisher:Cengage Learning
 Financial And Managerial AccountingAccountingISBN:9781337902663Author:WARREN, Carl S.Publisher:Cengage Learning,
Survey of Accounting (Accounting I)
Accounting
ISBN:9781305961883
Author:Carl Warren
Publisher:Cengage Learning
Managerial Accounting
Accounting
ISBN:9781337912020
Author:Carl Warren, Ph.d. Cma William B. Tayler
Publisher:South-Western College Pub
Financial Accounting
Accounting
ISBN:9781337272124
Author:Carl Warren, James M. Reeve, Jonathan Duchac
Publisher:Cengage Learning
Managerial Accounting: The Cornerstone of Busines...
Accounting
ISBN:9781337115773
Author:Maryanne M. Mowen, Don R. Hansen, Dan L. Heitger
Publisher:Cengage Learning
Financial And Managerial Accounting
Accounting
ISBN:9781337902663
Author:WARREN, Carl S.
Publisher:Cengage Learning,
Profitability index; Author: The Finance Storyteller;https://www.youtube.com/watch?v=Md5ocNqKHq8;License: Standard Youtube License