
Videos
The Safe Drinking Water Act, which was passed in 1974, allows the Environmental Protection Agency (EPA) to regulate the levels of contaminants in drinking water. The EPA requires that water utilities give their customers water quality reports annually. These reports include the results of daily water quality monitoring, which is performed to determine whether drinking water is safe for consumption.
A water department tests for contaminants at water treatment plants and at customers laps. These contaminants include microorganisms, organic chemicals, and inorganic chemicals such as cyanide. Cyanide’s presence in drinking water is the result of discharges from Steel, plastics, and fertilizer factories. For drinking water, the maximum contaminant level of cyanide is 0.2 part per million.
As part of your job for your city’s water department, you are preparing a report that includes an analysis of the results shown in the figure at the right. The figure shows the point estimates for the population mean concentration and the 95% confidence intervals for μ for cyanide over a three-year period. The data are based on random water samples taken by the city’s three water treatment plants.
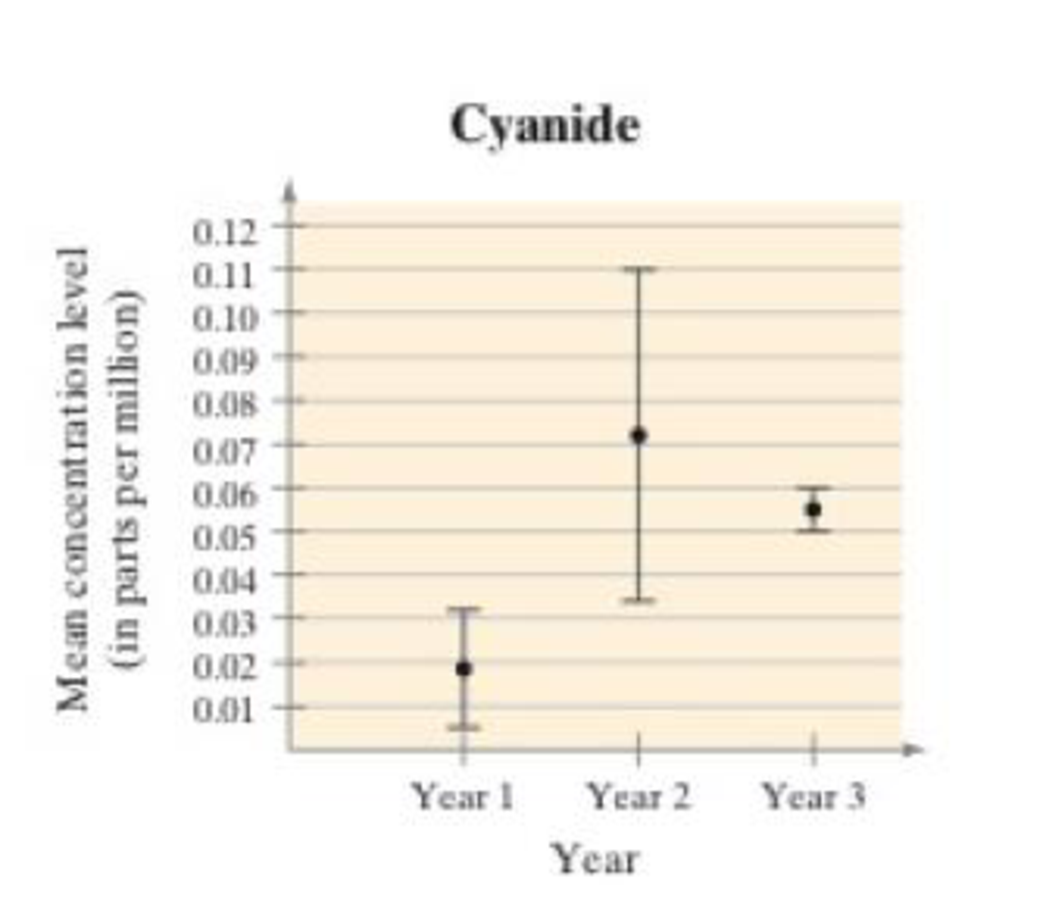
1. Interpreting the Results
Use the figure to determine whether there has been a change in the mean concentration level of cyanide for each time period. Explain your reasoning.
- (a) From Year 1 to Year 2
- (b) From Year 2 to Year 3
- (c) From Year 1 to Year 3
Want to see the full answer?
Check out a sample textbook solution
Chapter 6 Solutions
Elementary Statistics: Picturing the World (6th Edition)


- A car dealership keeps track of how much it spends on advertising each month and of its monthly revenue. From this information, the list of advertising expenditures and probable associated revenues are shown in the table below.arrow_forwardWhat do people actually order at Chipotle? How healthy is a normal Chipotle meal? Chipotle and other relatively new fast casual chains like Shake Shack, Potbelly and Five Guys typically promote themselves as having healthier menu choices than the traditional fast food outlets like McDonald's, Taco Bell, Burger King, etc.The recommended daily calorie intake for most adults is 1,600 to 2,400. The histogram below shows the calories in approximately 3,000 meals ordered from Chipotle on Grubhub.While the histogram is not perfectly symmetric (there is mild right skewness), it is close enough to being symmetric and bell-shaped to justify using the 68-95-99.7 rule. Suppose the distribution of calories in a Chipotle meal can be considered symmetric and bell-shaped with mean 1079 calories and standard deviation 296 calories. Use the 68-95-99.7 rule to answer the following questions.a. What is the approximate percentage of the Chipotle meals that have between 487 and 1671 calories?b. The middle…arrow_forwardThe table below gives adult wine consumption.arrow_forward
- The goal of a research study is to provide an accurate picture of the status or characteristics of a situation or phenomenon. This study is best described as: A. Explanatory B. Descriptive C. Predictive D. Confirmatoryarrow_forwardMORTALITY RATE Table 3.5 provides the number of deaths from all causes and from accidents (unintentional injuries) by age group in the United States in 2002. Review the following rates. Determine what to call each one, then calculate it using the data provided in Table. 1. Unintentional-injury-specific mortality rate for the entire population. Calculate cause-specific mortality rate. 2. All-cause mortality rate for 25-34 years old. Calculate the age-specific mortality rate. 3. All-cause mortality among males. Calculate the sex-specific mortality rate. 4. Unintentional-injury specific mortality among 25 to 34 years old males. Calculate the is a cause-specific, age-specific, and sex-specific mortality rate Table 3.5 All-Cause and Unintentional Injury Mortality and Estimated Population by Age Group, For Both Sexes and For Males Alone- United States, 2002 All Races, Both Sexes All Races, Males Age group (years) All Causes Unintentional Estimated All Unintentional Estimated Injuries Pop. (x…arrow_forwardThe daily sales figures shown below have been recorded in a medium size insurance companyarrow_forward
- A magazine published a study on the ammonia levels near the exit ramp of a highway tunnel. The data in the table below represent daily ammonia concentrations (in parts per million) on eight randomly selected days during the afternoon drive time. Complete parts a through c.arrow_forwardCompute the appropriate summary measures for each variable.arrow_forwardWhat do people actually order at Chipotle? How healthy is a normal Chipotle meal? Chipotle and other relatively new healthier menu choices than the traditional fast food outlets like McDonald's, Taco Bell, Burger King, etc. fast casual chains like Shake Shack, Potbelly and Five Guys typically promote themselves as having The recommended daily calorie intake for most adults is 1,600 to 2,400. The histogram below shows the calories in approximately 3,000 meals ordered from Chipotle on Grubhub. Many burritos and burrito bowls end up with 900 to 1,000 calories. Recommended dietary allowance 2,000 calories 6% of meals 5% This small bump is 4% mostly from sides of chips and guacamole. 3% 2% About 2 percent of meals had more than 2,000 calories. 1% 200 400 600 800 1,000 1,200 1,400 1,600 1,800 2,000 2,200 2,400 2,600 2,800 While the histogram not perfectly symmetric (there is mild right skewness), it is close enough to being symmetric and bell-shaped to justify using the 68-95-99.7 rule.…arrow_forward
- Major League Baseball (MLB) consists of teams that play in the American League and the National League. MLB collects a wide variety of team and player statistics. Some of the statistics often used to evaluate pitching performance are as follows: • ERA: The average number of earned runs given up by the pitcher per nine innings. An earned run is any run that the opponent scores off a particular pitcher except for runs scored as a result of errors. • SO/IP: The average number of strikeouts per inning pitched. • HR/IP: The average number of home runs per inning pitched. • R/IP: The number of runs given up per inning pitched. The following data show values for these statistics for a random sample of 20 pitchers from the American League for one full season. Player Тeam W ERA SO/IP HR/IP R/IP Verlander, J DET 24 2.40 1.00 0.09 0.29 Beckett, J BOS 13 7 2.88 0.92 0.12 0.35 Wilson, C TEX 16 7 2.93 0.93 0.08 0.40 Sabathia, C ΝY 19 8. 3.01 0.97 0.06 0.36 Haren, D LAA 16 10 3.16 0.80 0.08 0.37…arrow_forwardDetermine if the following scenarios involve an observational study or an experiment. Make sure your answers are legible and spelled correctly. A team of ecologists determines the different species of frogs that live in the local swamplands. A medical researcher divides patients into a treatment group and a control group to determine the effect of a new drug on overall cholesterol levels in patients. A medical insurance company determines the average cost to cover a tooth extraction procedure over the past 3 years. As part of a medical study to determine the effectiveness of a new technique for abdominal surgery, patients undergo the surgery with the new technique or with a traditional technique. The recovery time from surgery is then compared for the two different techniques. The general manager of a baseball team determines the on-base percentage (OBP) for his players over the past two seasons. A dietitian examined the effectiveness of a weight-loss program by randomly…arrow_forwardMercury in Sushi An FDA guideline is that the mercury in fish should be below 1 part per million (ppm). Listed below are the amounts of mercury (ppm) found in tuna sushi sampled at different stores in New York City. The study was sponsored by the New York Times, and the stores (in order) are D’Agostino, Eli’s Manhattan, Fairway, Food Emporium, Gourmet Garage, Grace’s Marketplace, and Whole Foods. Construct a 98% confidence interval estimate of the mean amount of mercury in the population. Does it appear that there is too much mercury in tuna sushi?arrow_forward
 Calculus For The Life SciencesCalculusISBN:9780321964038Author:GREENWELL, Raymond N., RITCHEY, Nathan P., Lial, Margaret L.Publisher:Pearson Addison Wesley,
 Linear Algebra: A Modern IntroductionAlgebraISBN:9781285463247Author:David PoolePublisher:Cengage Learning