
Concept explainers
Videos
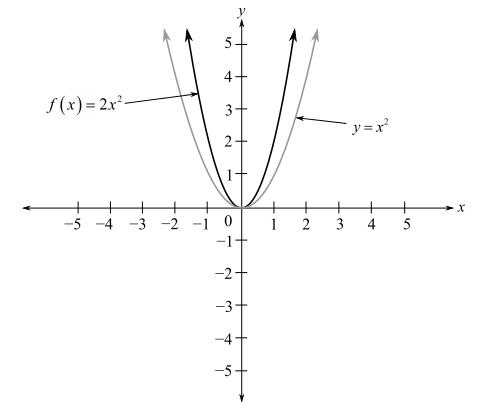
(a)
To graph: The quadratic function
(a)
Explanation of Solution
Graph:
Consider the general quadratic function in standard form.
Here,
Now, consider the function,
Here,
Then, the graph for the function
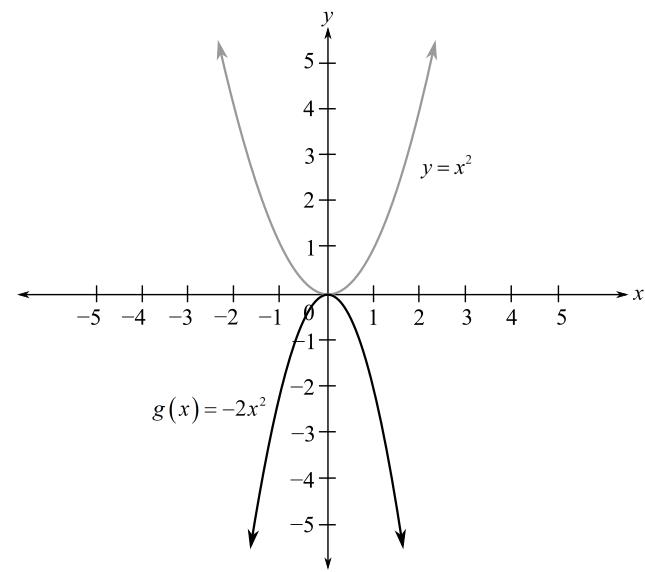
(b)
To graph: The quadratic function
(b)
Explanation of Solution
Graph:
Consider the function,
Here,
Then, the graph for the function
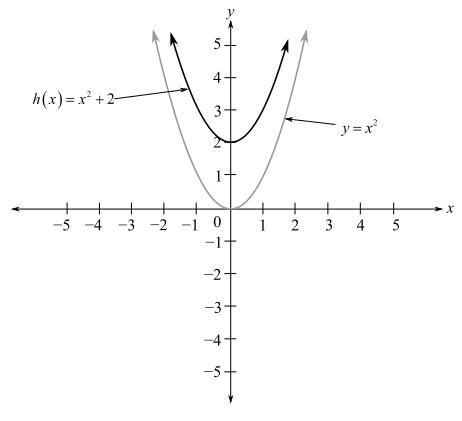
(c)
To graph: The quadratic function
(c)
Explanation of Solution
Graph:
Now, consider the function,
Here,
Then, the graph for the function
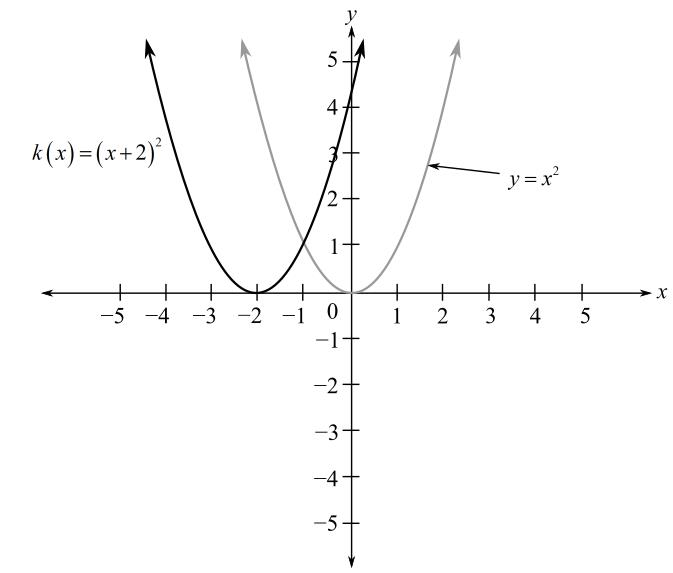
(d)
To graph: The quadratic function
(d)
Explanation of Solution
Graph:
Now, consider the function,
Here,
Then, the graph for the function
Want to see more full solutions like this?
Chapter 3 Solutions
College Algebra


- Sketching Graphs of Quadratic Functions In Exercises 9-12, sketch the graph of each quadratic function and compare it with the graph of y=x2. (a)fx=x2+1(b)gx=x21(c)kx=x2+3(d)kx=x23arrow_forwardIn Exercises 9-14, match the polynomial function with its graph. [The graphs are labeled (a), (b), (c), (d), (e), and (f).] f(x)=2x25xarrow_forwardTraffic Accidents The following table shows the cost C of traffic accidents. in cents per vehicle-mile, as a function of vehicular speed s, in miles per hour, for commercial vehicles driving at night on urban streets. Speed s 20 25 30 35 40 45 50 Cost C 1.3 0.4 0.1 0.3 0.9 2.2 5.8 The rate of vehicular involvement in traffic accidents per vehicle-mile can be modeled as a quadratic function of vehicular speed s, and the cost per vehicular involvement is roughly a linear function of s, so we expect that C the product of these two functions can be modeled as a cubic function of s. a. Use regression to find a cubic model for the data. Keep two decimal places for the regression parameters written in scientific notation. b. Calculate C(42) and explain what your answer means in practical terms. c. At what speed is the cost of traffic accidents for commercial vehicles driving at night on urban streets at a minimum? Consider speeds between 20 and 50 miles per hour.arrow_forward
- Fill in the blanks. When the graph of a quadratic function opens downward, its leading coefficient is and the vertex of the graph is a .arrow_forwardHeight of a basketball The path of a basketball thrown from the free throw line can be modeled by the quadratic function f(x)=0.06x2+1.5x+6, where x is the horizontal distance in feet from the free throw line and f(x) is the height in feet of the ball. Find the maximum height of the basketball.arrow_forwardIn Exercises 57-62, find two quadratic functions, one that opens upward and one that opens downward, whose graphs have the given x-intercepts (There are many correct answers.) (5,0),(5,0)arrow_forward

 Big Ideas Math A Bridge To Success Algebra 1: Stu...AlgebraISBN:9781680331141Author:HOUGHTON MIFFLIN HARCOURTPublisher:Houghton Mifflin Harcourt
 Elementary Linear Algebra (MindTap Course List)AlgebraISBN:9781305658004Author:Ron LarsonPublisher:Cengage Learning
 College Algebra (MindTap Course List)AlgebraISBN:9781305652231Author:R. David Gustafson, Jeff HughesPublisher:Cengage Learning
 Algebra and Trigonometry (MindTap Course List)AlgebraISBN:9781305071742Author:James Stewart, Lothar Redlin, Saleem WatsonPublisher:Cengage Learning
 Algebra & Trigonometry with Analytic GeometryAlgebraISBN:9781133382119Author:SwokowskiPublisher:Cengage