
Statistics Through Applications
2nd Edition
ISBN: 9781429219747
Author: Daren S. Starnes, David Moore, Dan Yates
Publisher: Macmillan Higher Education
expand_more
expand_more
format_list_bulleted
Videos
Question
Chapter 2.2, Problem 2.43E
To determine
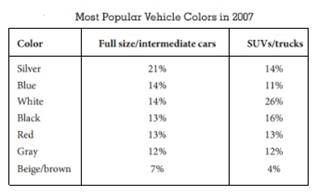
To construct: the graph which compares the colours distribution for full size/intermediate cars and SUV/trucks.
Expert Solution & Answer
Explanation of Solution
Given:
Graph:
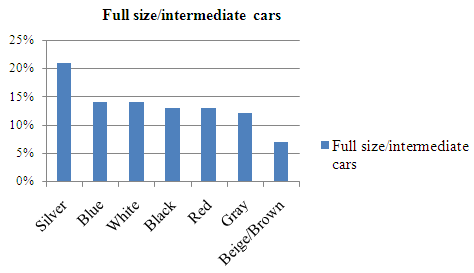
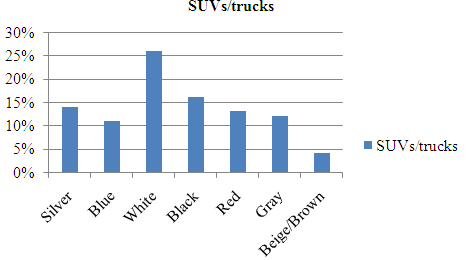
By seeing both the graphs which are similar in this way that the same categories and beige/brown is the least popular in both the graphs but there is difference in the full size/intermediate cars category the silver cars are almost popular while in the SUV/trucks category the white cars are the most popular
Chapter 2 Solutions
Statistics Through Applications
Ch. 2.1 - Prob. 2.1ECh. 2.1 - Prob. 2.2ECh. 2.1 - Prob. 2.3ECh. 2.1 - Prob. 2.4ECh. 2.1 - Prob. 2.5ECh. 2.1 - Prob. 2.6ECh. 2.1 - Prob. 2.7ECh. 2.1 - Prob. 2.8ECh. 2.1 - Prob. 2.9ECh. 2.1 - Prob. 2.10E
Ch. 2.1 - Prob. 2.11ECh. 2.1 - Prob. 2.12ECh. 2.1 - Prob. 2.13ECh. 2.1 - Prob. 2.14ECh. 2.1 - Prob. 2.15ECh. 2.1 - Prob. 2.16ECh. 2.1 - Prob. 2.17ECh. 2.1 - Prob. 2.19ECh. 2.1 - Prob. 2.20ECh. 2.1 - Prob. 2.21ECh. 2.1 - Prob. 2.23ECh. 2.1 - Prob. 2.24ECh. 2.1 - Prob. 2.25ECh. 2.1 - Prob. 2.26ECh. 2.2 - Prob. 2.27ECh. 2.2 - Prob. 2.28ECh. 2.2 - Prob. 2.29ECh. 2.2 - Prob. 2.30ECh. 2.2 - Prob. 2.31ECh. 2.2 - Prob. 2.32ECh. 2.2 - Prob. 2.33ECh. 2.2 - Prob. 2.34ECh. 2.2 - Prob. 2.35ECh. 2.2 - Prob. 2.36ECh. 2.2 - Prob. 2.37ECh. 2.2 - Prob. 2.38ECh. 2.2 - Prob. 2.39ECh. 2.2 - Prob. 2.40ECh. 2.2 - Prob. 2.41ECh. 2.2 - Prob. 2.42ECh. 2.2 - Prob. 2.43ECh. 2.2 - Prob. 2.44ECh. 2.2 - Prob. 2.45ECh. 2.2 - Prob. 2.46ECh. 2.2 - Prob. 2.47ECh. 2.2 - Prob. 2.48ECh. 2.2 - Prob. 2.49ECh. 2.2 - Prob. 2.50ECh. 2.2 - Prob. 2.51ECh. 2.2 - Prob. 2.52ECh. 2.3 - Prob. 2.53ECh. 2.3 - Prob. 2.54ECh. 2.3 - Prob. 2.55ECh. 2.3 - Prob. 2.56ECh. 2.3 - Prob. 2.57ECh. 2.3 - Prob. 2.58ECh. 2.3 - Prob. 2.59ECh. 2.3 - Prob. 2.60ECh. 2.3 - Prob. 2.61ECh. 2.3 - Prob. 2.62ECh. 2.3 - Prob. 2.63ECh. 2.3 - Prob. 2.64ECh. 2.3 - Prob. 2.65ECh. 2 - Prob. 2.67RECh. 2 - Prob. 2.68RECh. 2 - Prob. 2.69RECh. 2 - Prob. 2.70RECh. 2 - Prob. 2.71RECh. 2 - Prob. 2.72RECh. 2 - Prob. 2.73RECh. 2 - Prob. 2.74RECh. 2 - Prob. 2.75RECh. 2 - Prob. 2.76RE
Additional Math Textbook Solutions
Find more solutions based on key concepts
Explain the meaning of the term “statistically significant difference” in statistics terminology.
Intro Stats
Of versus More Than. Explain the difference between the key words of and more than when dealing with percentage...
Statistical Reasoning for Everyday Life (5th Edition)
2.1 Complete the following table.
Statistics for Business and Economics (13th Edition)
8. Effect of Blinding Among 13,200 submitted abstracts that were blindly evaluated (with authors and institutio...
Essentials of Statistics, Books a la Carte Edition (5th Edition)
Matching In Exercises 17–20, match the level of confidence c with the appropriate confidence interval. Assume e...
Elementary Statistics: Picturing the World (6th Edition)
Explain the meaning of straightening the scatterplot regarding the regression of response variable y on a predi...
Introductory Statistics (10th Edition)
Knowledge Booster


Learn more about
Need a deep-dive on the concept behind this application? Look no further. Learn more about this topic, statistics and related others by exploring similar questions and additional content below.Recommended textbooks for you
 MATLAB: An Introduction with ApplicationsStatisticsISBN:9781119256830Author:Amos GilatPublisher:John Wiley & Sons Inc
 Probability and Statistics for Engineering and th...StatisticsISBN:9781305251809Author:Jay L. DevorePublisher:Cengage Learning
 Statistics for The Behavioral Sciences (MindTap C...StatisticsISBN:9781305504912Author:Frederick J Gravetter, Larry B. WallnauPublisher:Cengage Learning
 Elementary Statistics: Picturing the World (7th E...StatisticsISBN:9780134683416Author:Ron Larson, Betsy FarberPublisher:PEARSON
 The Basic Practice of StatisticsStatisticsISBN:9781319042578Author:David S. Moore, William I. Notz, Michael A. FlignerPublisher:W. H. Freeman
 Introduction to the Practice of StatisticsStatisticsISBN:9781319013387Author:David S. Moore, George P. McCabe, Bruce A. CraigPublisher:W. H. Freeman
MATLAB: An Introduction with Applications
Statistics
ISBN:9781119256830
Author:Amos Gilat
Publisher:John Wiley & Sons Inc
Probability and Statistics for Engineering and th...
Statistics
ISBN:9781305251809
Author:Jay L. Devore
Publisher:Cengage Learning
Statistics for The Behavioral Sciences (MindTap C...
Statistics
ISBN:9781305504912
Author:Frederick J Gravetter, Larry B. Wallnau
Publisher:Cengage Learning
Elementary Statistics: Picturing the World (7th E...
Statistics
ISBN:9780134683416
Author:Ron Larson, Betsy Farber
Publisher:PEARSON
The Basic Practice of Statistics
Statistics
ISBN:9781319042578
Author:David S. Moore, William I. Notz, Michael A. Fligner
Publisher:W. H. Freeman
Introduction to the Practice of Statistics
Statistics
ISBN:9781319013387
Author:David S. Moore, George P. McCabe, Bruce A. Craig
Publisher:W. H. Freeman
How to make Frequency Distribution Table / Tally Marks and Frequency Distribution Table; Author: Reenu Math;https://www.youtube.com/watch?v=i_A6RiE8tLE;License: Standard YouTube License, CC-BY
Frequency distribution table in statistics; Author: Math and Science;https://www.youtube.com/watch?v=T7KYO76DoOE;License: Standard YouTube License, CC-BY
Frequency Distribution Table for Grouped/Continuous data | Math Dot Com; Author: Maths dotcom;https://www.youtube.com/watch?v=ErnccbXQOPY;License: Standard Youtube License