
Essentials Of Business Analytics
1st Edition
ISBN: 9781285187273
Author: Camm, Jeff.
Publisher: Cengage Learning,
expand_more
expand_more
format_list_bulleted
Concept explainers
Videos
Textbook Question
Chapter 2, Problem 17P
Suppose that you initially invested $10,000 in the Stivers mutual fund and $5,000 in the Trippi mutual fund. The value of each investment at the end of each subsequent year is provided in the table:
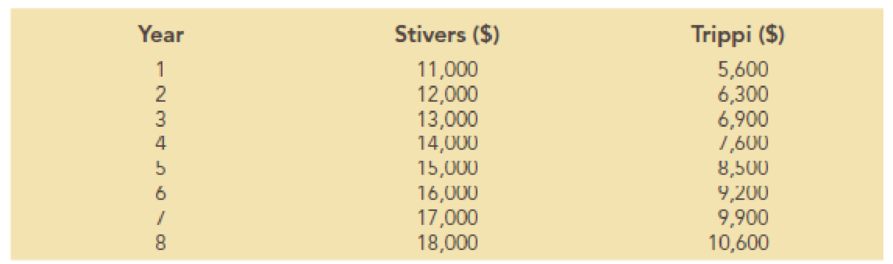
Which of the two mutual funds performed better over this time period?
Expert Solution & Answer

Trending nowThis is a popular solution!

Chapter 2 Solutions
Essentials Of Business Analytics
Ch. 2 - A Wall Street Journal subscriber survey asked 46...Ch. 2 - The following table contains a partial list of...Ch. 2 - Ohio Logistics manages the logistical activities...Ch. 2 - A partial relative frequency distribution is...Ch. 2 - In a recent report, the top five syndicated...Ch. 2 - In a study of how chief executive officers (CEOs)...Ch. 2 - Consumer complaints are frequently reported to the...Ch. 2 - Reports have found that many U.S. adults would...Ch. 2 - Consider the following data: a. Develop a...Ch. 2 - Consider the following frequency distribution....
Ch. 2 - The owner of an automobile repair shop studied the...Ch. 2 - Approximately 1.65 million high school students...Ch. 2 - Consider a sample with data values of 10, 20, 12,...Ch. 2 - Consider a sample with data values of 27, 25, 20,...Ch. 2 - Consider a sample with data values of 53, 55, 70,...Ch. 2 - If an asset declines in value from 5,000 to 3,500...Ch. 2 - Suppose that you initially invested 10,000 in the...Ch. 2 - The average time that Americans commute to work is...Ch. 2 - Suppose that the average waiting time for a...Ch. 2 - According to the National Education Association...Ch. 2 - Return to the waiting times given for the...Ch. 2 - The results of a national survey showed that on...Ch. 2 - Suppose that the national average for the math...Ch. 2 - Five observations taken for two variables follow....Ch. 2 - The scatter chart in the following figure was...Ch. 2 - The economic downturn in 20082009 resulted in the...Ch. 2 - Heavenly Chocolates manufactures and sells quality...
Knowledge Booster


Learn more about
Need a deep-dive on the concept behind this application? Look no further. Learn more about this topic, statistics and related others by exploring similar questions and additional content below.Similar questions
Recommended textbooks for you

 Intermediate AlgebraAlgebraISBN:9781285195728Author:Jerome E. Kaufmann, Karen L. SchwittersPublisher:Cengage Learning
 Algebra for College StudentsAlgebraISBN:9781285195780Author:Jerome E. Kaufmann, Karen L. SchwittersPublisher:Cengage Learning
 Algebra & Trigonometry with Analytic GeometryAlgebraISBN:9781133382119Author:SwokowskiPublisher:Cengage
Intermediate Algebra
Algebra
ISBN:9781285195728
Author:Jerome E. Kaufmann, Karen L. Schwitters
Publisher:Cengage Learning
Algebra for College Students
Algebra
ISBN:9781285195780
Author:Jerome E. Kaufmann, Karen L. Schwitters
Publisher:Cengage Learning
Algebra & Trigonometry with Analytic Geometry
Algebra
ISBN:9781133382119
Author:Swokowski
Publisher:Cengage
The Shape of Data: Distributions: Crash Course Statistics #7; Author: CrashCourse;https://www.youtube.com/watch?v=bPFNxD3Yg6U;License: Standard YouTube License, CC-BY
Shape, Center, and Spread - Module 20.2 (Part 1); Author: Mrmathblog;https://www.youtube.com/watch?v=COaid7O_Gag;License: Standard YouTube License, CC-BY
Shape, Center and Spread; Author: Emily Murdock;https://www.youtube.com/watch?v=_YyW0DSCzpM;License: Standard Youtube License