Videos
Find Data for Profit
Required
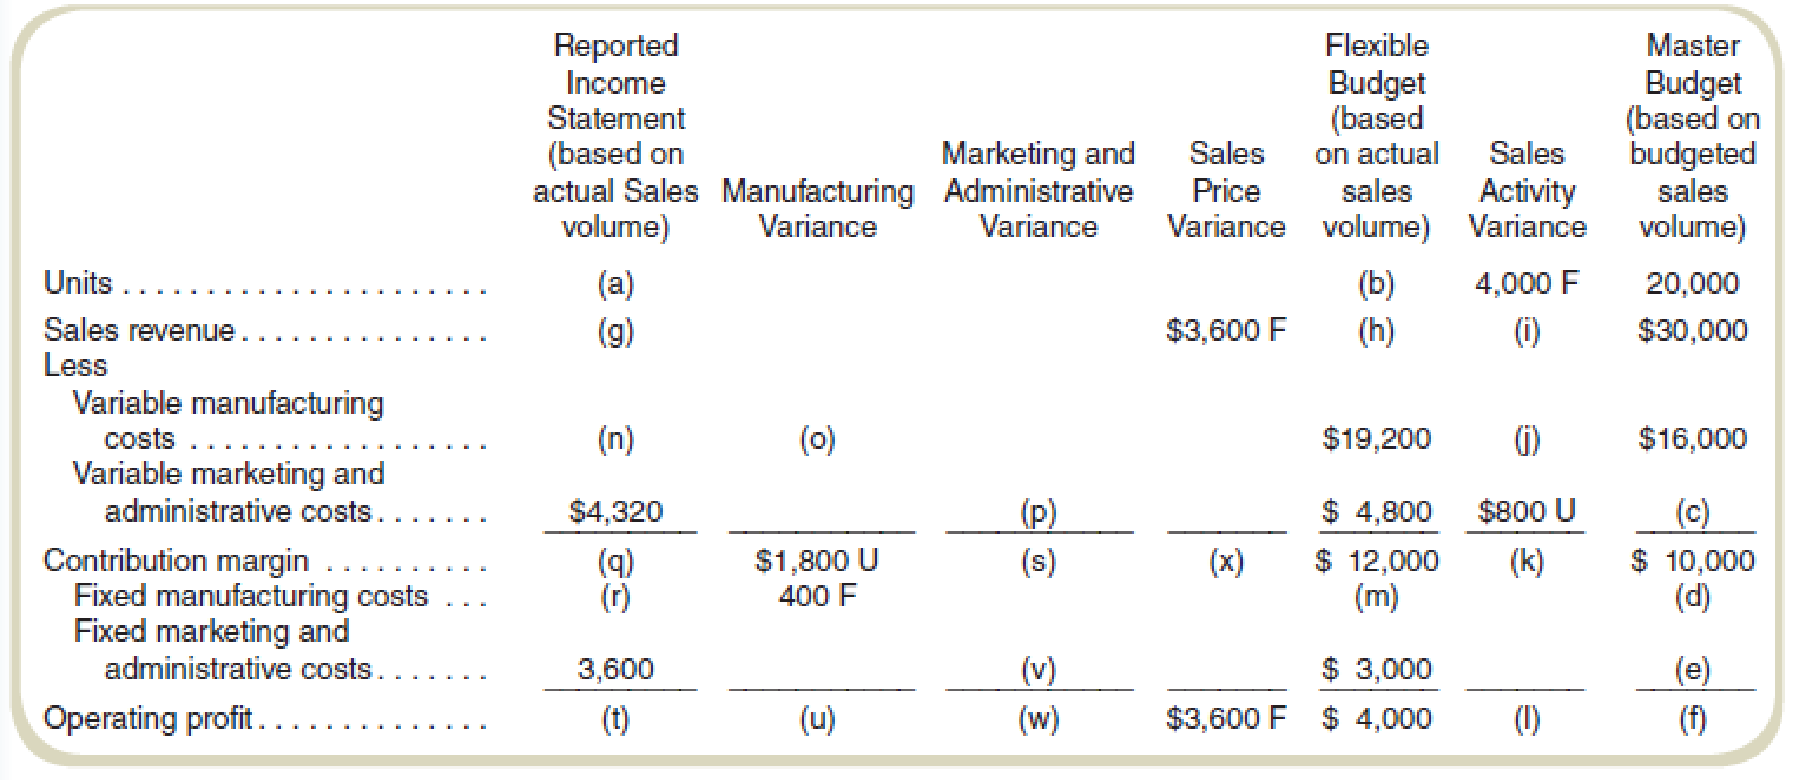
Find the values of the missing items (a) through (x). Assume that actual sales volume equals actual production volume. (There are no inventory level changes.)
Find the missing data to prepare profit variance analysis.
Explanation of Solution
Profit variance analysis:
The analysis that studies the difference between the actual operating profit and the standard operating profit is called the profit variance analysis.
Prepare profit variance analysis:
| Actual Revenue & Costs | Manufacturing variance | Marketing and administrative variance | Sales price variance | Flexible budget | Sales Activity Variance | Master budget | |
| Units Produced | 24,000(1) | 24,000 | 4,000F(2) | 20,000 | |||
| Sales revenue | $39,600(7) | $3,600F | $36,000(6) | $6,000F(8) | $30,000 | ||
| Less: Variable costs | |||||||
| Manufacturing | $21,000(10) | $1,800U(9) | $19,200 | $3,200U | $16,000 | ||
| Marketing &administrative costs | $4,320 | $480F(11) | $4,800 | $800U | $4,000 | ||
| Contribution margin | $14,280(12) | $1,800U | $480F | $3,600F | $12,000 | $2,000F | $10,000 |
| Less: Fixed Costs | |||||||
| Manufacturing | $4,600(13) | $400F | $5,000(3) | $5,000 | |||
| Marketing &administrative costs | $3,600 | $600U(16) | $3,000(4) | $3,000 | |||
| Operating Profits | $6,080(14) | $1,400U(15) | $120U(17) | $3,600F | $4,000 | $2,000F | $2,000(5) |
Table: (1)
Working Note 1:
Actual units and fixed budget units:
Working Note 2:
Budgeted variable marketing and administrative cost:
Working Note 3:
Flexible budget fixed manufacturing cost:
Working Note 4:
Master budget fixed marketing and administrative cost:
Fixed cost in the master budget will be the same as given in the flexible budget which is $3,000.
Working Note 5:
Master budget operating profit:
Working Note 6:
Flexible budget sales revenue:
Working Note 7:
Actual sales revenue:
Working Note 8:
Sales activity variance:
Working Note 9:
Manufacturing variance will be equal to the total manufacturing variance which is $1,800U.
Working Note 10:
Actual variable manufacturing cost:
Working Note 11:
Marketing and administrative variance:
Working Note 12:
Contribution margin:
Working Note 13:
Actual fixed manufacturing cost:
Working Note 14:
Operating profit:
Working Note 15:
Total manufacturing variance:
Working Note 16:
Fixed marketing and administrative variance:
Working Note 17:
Total marketing and administrative variance:
Want to see more full solutions like this?
Chapter 16 Solutions
Fundamentals Of Cost Accounting (6th Edition)


- In the cost-volume-profit graph,a. the break-even point is found where the total revenue curve crosses the x-axis.b. the area of profit is to the left of the break-even point.c. the area of loss cannot be determined.d. both the total revenue curve and the total cost curve appear.e. neither the total revenue curve nor the total cost curve appear.arrow_forwardBelow is the information on a project that you are evaluating for deciding on its worthiness as an investment. ABC company is considering a new investment whose data are shown below. WACC for the project under consideration Net investment in fixed assets (immediate) Required new working capital (immediate) Working capital from the end of the first year onwards as a Percentage of Sales Straight line deprec. Rate (every year end from the end of year 1} Sales revenues (starting at the end of year 1) Operating cost excluding depreciation, (starting at the end of year 1) 10% 75000 15000 25% 33.33% 75000 25000 Tax Rate Annual increase in Operating Costs each year from year 2 onwards Annual increase in Sales revenue from the end of the year 2 onwards Depreciation: Fixed assets to be fully depreciated in books using the straight line method over 4 years to zero Salvage value of the fixed assets at the end of the project life 35% 6% 9750arrow_forwardGross profit variance analysis can be used to study the effect of: a. Changes in volume of goods sold on a company's profitability. b. Changes in cost of goods sold on a company's profitability. c. Changes in product sales mix on a company's profitability. d. All of the choices. e. Changes in selling prices on a company's profitability.arrow_forward
- Gross profit variance analysis can be used to study the effect of: a. Changes in cost of goods sold on a company's profitability. b. Changes in selling prices on a company's profitability. c. Changes in volume of goods sold on a company's profitability. d. All of the choices. Changes in product sales mix on a company's profitability.arrow_forwardWhen selling prices and inventory costs are stable, a decrease in units sold would result to _sales volume variance and cost volume variance. A. favorable; favorable C. unfavorable; favorable B. unfavorable; unfavorable D. favorable; unfavorablearrow_forwardGross profit variance analysis can be used to study the effect of: " Changes in cost of goods sold on a company's profitability. O Changes in product sales mix on a company's profitability. Changes in selling prices on a company's profitability. O All of the choices. O Changes in volume of goods sold on a company's profitability.arrow_forward
- Which one of the following is not considered an assumption of cost-volume-profit analysis? a. Selling price per unit does not change with volume b. Costs can be divided into variable and fixed components C. Fixed cost per unit is not constant d. Sales mix of products sold does not change O e. Costs are nonlineararrow_forwardOn a cost-volume-profit graph, when the Total Cost line is higher than the Total Revenue line, the difference represents Select one: O A. a positive return on the investment O B. a net loss O C. net income O D. not enough information is presentedarrow_forwardWhich of the following is an assumption of cost-volume-profit analysis? a. The inventory quantities during the period can change. b. Within the relevant range of operating activity, the efficiency of operations can change. c. Costs can be divided into fixed and variable components. d. The sales mix can vary. 5 Which of the following is an assumption of cost-volume-profit analysis? a. The inventory quantities during the period can change. b. Within the relevant range of operating activity, the efficiency of operations can change. c. Costs can be divided into fixed and variable components. d. The sales mix can vary.arrow_forward
- A Cost-Volume-Profit graph contains an "Area of Loss" and an "Area ofProfitability". Which of the following best explains the difference between thetwo points on the graph? A. The area of loss represents the difference between Sales and Variable Cost.B. The area of loss begins with the concept that fixed costs have to be recovered priorto sales contributing to profit.C. The area of profit represents the difference between Sales and Variable Cost.D. The area of profit begins with the concept that no company would have any level ofsales below the break-even point.arrow_forwardWhich of the following statements is false? a. The price factor refers to the change in selling or cost prices assuming there has been no change in units sold. b. The net gross profit variance can be computed by adding the sales price variance and the cost price variance. c. The price-volume factor refers to the sales or cost of sales variances due to the combined effects of the differences in prices and units sold d. The quantity factor refers to the change in the number of units sold assuming there has been no change in the selling or cost prices.arrow_forwardHow do costs behave when there is a change in volume?a) ______ increases or decreases in total in direct proportion to increases or decreases in sales volume. b) ______ remains the same in total, regardless of change in sales. c) ______ have both a variable and fixed component. d) Answer the following regarding the high-low method:i) What is the formula for determining the variable costs when using the high low method:ii) Given the following information for the high and low levels, what is the variable cost per unit and the total fixed costs? iii) Based on the information in part ii), what is the relevant range?In MyAccountingLab, complete Try It! 21-1 and S21-1 through S21-3.LO2. What is contribution margin, and how is it used to compute operating income?a) What is the contribution margin if net sales revenue is $100,000 and variable costs are $40,000? b) Based on the information in part a), what is the contribution margin ratio?In MyAccountingLab, complete Try It! 21-2 and S21-4 and…arrow_forward
 Managerial Accounting: The Cornerstone of Busines...AccountingISBN:9781337115773Author:Maryanne M. Mowen, Don R. Hansen, Dan L. HeitgerPublisher:Cengage Learning