
Concept explainers
Videos
1.
Complete the F table.
Make a decision to retain or reject the null hypothesis that the multiple regression equation can be used to significantly predict health.
1.
Answer to Problem 28CAP
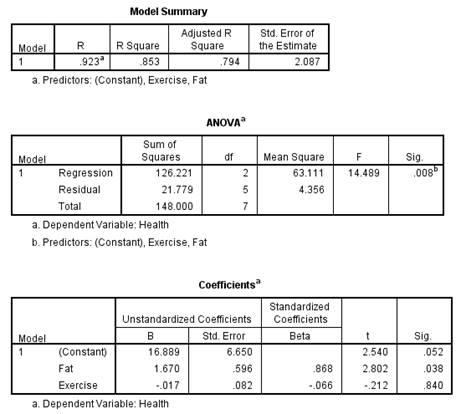
The completed F table is,
| Source of variation | SS | df | MS | |
| Regression | 126.22 | 2 | 63.11 | 14.48 |
| Residual (error) | 21.78 | 5 | 4.36 | |
| Total | 148.00 | 7 |
The decision is to reject the null hypothesis.
Theregression equation significantly predicts variance in criterion variable (Y) health [BMI].
Explanation of Solution
Calculation:
The given information is that, the researcher has tested whether ‘daily intake of fat (in grams)’ and ‘amount of exercise (in minutes)’ can predict health (measured using a body mass index [BMI] scale.
The formula for test statistic is,
Decision rules:
- If the test statistic value is greater than the critical value, then reject the null hypothesis
- If the test statistic value is smaller than the critical value, then retain the null hypothesis
Null hypothesis:
Alternative hypothesis:
Software procedure:
Step by step procedure to obtain test statistic value using SPSS software is given as,
- Choose Variable view.
- Under the name, enter the name as Fat, Exercise, Health.
- Choose Data view, enter the data.
- Choose Analyze>Regression>Linear.
- In Dependents, enter the column of Health.
- In Independents, enter the column of Fat, and Exercise.
- Click OK.
Output using SPSS software is given below:
The table of F is,
| Source of variation | SS | df | MS | |
| Regression | 126.22 | 2 | 63.11 | 14.48 |
| Residual (error) | 21.78 | 5 | 4.36 | |
| Total | 148.00 | 7 |
Table 1
Critical value:
The considered significance level is
The degrees of freedom for regression are 2, the degrees of freedom for residual are 5.
From the Appendix C: Table C.3-Critical values for F distribution:
- Locate the value 2 in degrees of freedomnumerator row.
- Locate the value 5 in degrees of freedomdenominator row.
- Locate the 0.05 level of significance (value in lightface type) in combined row.
- The intersecting value that corresponds to the (2, 5) with level of significance 0.05 is 5.79.
Thus, the critical value for
Conclusion:
The value of test statistic is 14.48.
The critical value is 5.79.
The test statistic value is greater than the critical value.
The test statistic value falls under critical region.
Hence the null hypothesis is rejected.
Thus, the regression equation significantly predicts variance in criterion variable (Y) health [BMI].
2.
Determine which predictor variable or variables, when added to the multiple regression equation, significantly contributed to predictions in Y (health).
2.
Answer to Problem 28CAP
The predictor variabledaily intake of fat significantly contributed to predictions in Y (health) when added to the multiple regression equation.
Explanation of Solution
Calculation:
The given information is that, a sample of 8 scores is recorded. The predictor variables are ‘daily intake of fat (in grams)
Relative contribution to fat
Null hypothesis:
Alternative hypothesis:
The predictor variable fat is tested. The other predictor variable that is not tested is ‘Exercise’. Calculate the correlation between ‘Exercise’ and ‘Health[BMI]’.
Software procedure:
Step by step procedure to obtain correlation using SPSS software is given as,
- Choose Variable view.
- Under the name, enter the name as Health, Exercise.
- Choose Data view, enter the data.
- Choose Analyze>Correlate>Bivariate.
- In variables, enter the Health, and Exercise.
- Click OK.
Output using SPSS software is given below:
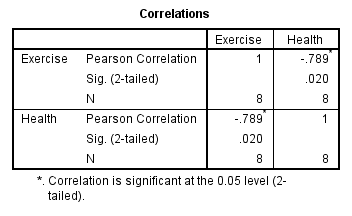
The correlation between ‘Exercise’ and ‘Health [BMI]’ is –0.789.
The value of
The formula for
The calculation of sums of squares is,
|
Health [BMI] (Y) | |
| 32 | 1,024 |
| 34 | 1,156 |
| 23 | 529 |
| 33 | 1,089 |
| 28 | 784 |
| 27 | 729 |
| 25 | 625 |
| 22 | 484 |
Table 2
Substitute,
The contribution of
From the F table, the value of
The contribution of
Reproduce the F table by replacing,
Since there would be only one predictor variable, the degrees of freedom for regression would be 1.
The mean sums of squares for regression is,
The F statistic value is,
The change F table with
| Source of variation | SS | df | MS | |
| Regression | 34.09 | 1 | 34.09 | 7.82 |
| Residual (error) | 21.78 | 5 | 4.36 | |
| Total | 148.00 | 7 |
Critical value:
The considered significance level is
The degrees of freedom for regression are 1, the degrees of freedom for residual are 5.
From the Appendix C: Table C.3-Critical values for F distribution:
- Locate the value 1 in degrees of freedom numerator row.
- Locate the value 5 in degrees of freedom denominator row.
- Locate the 0.05 level of significance (value in lightface type) in combined row.
- The intersecting value that corresponds to the (1, 5) with level of significance 0.05 is 6.61.
Thus, the critical value for
Conclusion:
The value of test statistic is 7.82.
The critical value is 6.61.
The test statistic value is greater than the critical value.
The test statistic value falls under critical region.
Hence the null hypothesis is rejected.
Thus, adding fat
Relative contribution to exercise
Null hypothesis:
Alternative hypothesis:
The predictor variable exercise is tested. The other predictor variable that is not tested is ‘fat’. Calculate the correlation between ‘fat’ and ‘Health [BMI]’.
Software procedure:
Step by step procedure to obtain correlation using SPSS software is given as,
- Choose Variable view.
- Under the name, enter the name as Health, Fat.
- Choose Data view, enter the data.
- Choose Analyze>Correlate>Bivariate.
- In variables, enter the Health, and Fat.
- Click OK.
Output using SPSS software is given below:
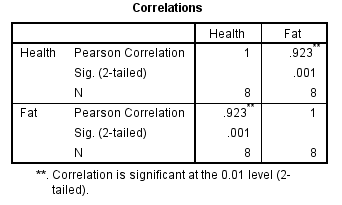
The correlation between ‘fat’ and ‘Health [BMI]’ is 0.923.
The value of
The value for
From the F table, the value of
The contribution of
Reproduce the F table by replacing,
Since there would be only one predictor variable, the degrees of freedom for regression would be 1.
The mean sums of squares for regression is,
The F statistic value is,
The change F table with
| Source of variation | SS | df | MS | |
| Regression | 0.14 | 1 | 0.14 | 0.03 |
| Residual (error) | 21.78 | 5 | 4.36 | |
| Total | 148.00 | 7 |
The critical value for F table with
Conclusion:
The value of test statistic is 0.03.
The critical value is 6.61.
The test statistic value is less than the critical value.
The test statistic value does not fall under critical region.
Hence the null hypothesis is retained.
Thus, adding exercise
Hence, the predictor variable daily intake of fat significantly contributed to predictions in Y (health) when added to the multiple regression equation.
Want to see more full solutions like this?
Chapter 16 Solutions
Statistics for the Behavioral Sciences


- Find the equation of the regression line for the following data set. x 1 2 3 y 0 3 4arrow_forwardLife Expectancy The following table shows the average life expectancy, in years, of a child born in the given year42 Life expectancy 2005 77.6 2007 78.1 2009 78.5 2011 78.7 2013 78.8 a. Find the equation of the regression line, and explain the meaning of its slope. b. Plot the data points and the regression line. c. Explain in practical terms the meaning of the slope of the regression line. d. Based on the trend of the regression line, what do you predict as the life expectancy of a child born in 2019? e. Based on the trend of the regression line, what do you predict as the life expectancy of a child born in 1580?2300arrow_forward
 Functions and Change: A Modeling Approach to Coll...AlgebraISBN:9781337111348Author:Bruce Crauder, Benny Evans, Alan NoellPublisher:Cengage Learning
 Glencoe Algebra 1, Student Edition, 9780079039897...AlgebraISBN:9780079039897Author:CarterPublisher:McGraw Hill
 Calculus For The Life SciencesCalculusISBN:9780321964038Author:GREENWELL, Raymond N., RITCHEY, Nathan P., Lial, Margaret L.Publisher:Pearson Addison Wesley,
 Big Ideas Math A Bridge To Success Algebra 1: Stu...AlgebraISBN:9781680331141Author:HOUGHTON MIFFLIN HARCOURTPublisher:Houghton Mifflin Harcourt