Subpart (a):
Revenues, costs and profits.
Subpart (a):
Explanation of Solution
Table -1 shows the total quantity and respective price level.
Table -1
| Price | Quantity |
| 100 | 0 |
| 90 | 100,000 |
| 80 | 200,000 |
| 70 | 300,000 |
| 60 | 400,000 |
| 50 | 500,000 |
| 40 | 600,000 |
| 30 | 700,000 |
| 20 | 800,000 |
| 10 | 900,000 |
| 0 | 1,000,000 |
Total revenue can be calculated by using the following formula.
Substitute the respective values in Equation (1) to calculate the total revenue at price $90.
Total revenue is $9,000,000.
Total cost can be calculated by using the following formula.
Substitute the respective values in Equation (2) to calculate the total cost at quantity 100,000 units.
Total cost is $2,000,000.
Profit can be calculated by using the following formula.
Substitute the respective values in Equation (3) to calculate the profit for the quantity 100,000 units.
Profit is 7,000,000.
Table -2 shows the total revenue, total cost and profit that are obtained by using Equations (1), (2) and (3).
Table -2
| Price | Quantity | Total revenue | Total cost | Profit |
| 100 | 0 | 0 | 2,000,000 | -2,000,000 |
| 90 | 100,000 | 9,000,000 | 3,000,000 | 6,000,000 |
| 80 | 200,000 | 16,000,000 | 4,000,000 | 12,000,000 |
| 70 | 300,000 | 21,000,000 | 5,000,000 | 16,000,000 |
| 60 | 400,000 | 24,000,000 | 6,000,000 | 18,000,000 |
| 50 | 500,000 | 25,000,000 | 7,000,000 | 18,000,000 |
| 40 | 600,000 | 24,000,000 | 8,000,000 | 16,000,000 |
| 30 | 700,000 | 21,000,000 | 9,000,000 | 12,000,000 |
| 20 | 800,000 | 16,000,000 | 10,000,000 | 6,000,000 |
| 10 | 900,000 | 9,000,000 | 11,000,000 | -2,000,000 |
| 0 | 1,000,000 | 0 | 12,000,000 | -12,000,000 |
The maximum profit of $18 million is obtained at a quantity of 500,000 at a price of $50. Thus, the
Concept introduction:
Profit: Profit refers to the excess revenue after subtracting the total cost from the total revenue.
Total revenue: Total revenue refers to the revenue of a firm through its total sale of goods.
Total cost: Total cost refers to the cost of all the inputs used by the firm. It includes both the fixed cost and the variable costs.
Subpart (b):
Calculate marginal revenue.
Subpart (b):
Explanation of Solution
Marginal revenue can be calculated as follows:
Substitute the respective values in equation (4) to calculate the marginal revenue at price level $60.
Marginal revenue is $30.
Table -3 shows the marginal revenue that obtained by using equation (4).
Table -3
| Price | Quantity | Total revenue | Marginal revenue |
| 100 | 0 | 0 | - |
| 90 | 100,000 | 9,000,000 | $90 |
| 80 | 200,000 | 16,000,000 | 70 |
| 70 | 300,000 | 21,000,000 | 50 |
| 60 | 400,000 | 24,000,000 | 30 |
| 50 | 500,000 | 25,000,000 | 10 |
| 40 | 600,000 | 24,000,000 | -10 |
| 30 | 700,000 | 21,000,000 | -30 |
| 20 | 800,000 | 16,000,000 | -50 |
| 10 | 900,000 | 9,000,000 | -70 |
| 0 | 1,000,000 | 0 | -90 |
From table 4, it can be inferred that Marginal Revenue is less than price. Since the demand curve slopes downwards, Price declines when quantity rises. The marginal revenue declines even more than price because the firm loses revenue on all the units of the good sold when it lowers the price.
Concept introduction:
Marginal revenue: Marginal revenue refers to the amount of extra revenue attained in the process of increasing one more unit of output.
Subpart (c):
Profit maximization.
Subpart (c):
Explanation of Solution
Figure 1illustrates the
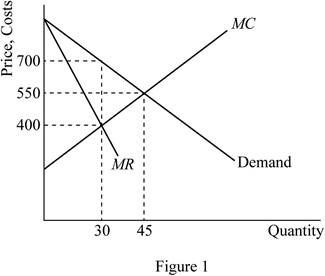
Figure 1 represents the marginal-revenue, marginal-cost, and demand curves. The horizontal axis represents the quantity and the vertical axis the prices, revenues and costs. The MR and MC curves cross between quantities of 400,000 and 500,000 which signify that the firm is maximizing profit in that region.
Concept introduction:
Marginal product of labor (MPL): Marginal product of labor refers to the additional output produced due to employing one more unit of labor.
Marginal product of capital (MPC): Marginal product of capital refers to the additional output produced due to employing one more unit of capital.
Profit maximization: A firm can maximize its profit at the point where its marginal revenue is equal to marginal cost.
Subpart (d):
Deadweight loss.
Subpart (d):
Explanation of Solution
The deadweight loss is depicted by area DWL in figure 1. Deadweight loss is greater in
Concept introduction:
Deadweight loss: Deadweight loss refers to loss of total economic benefit that arises due to the inefficient allocation of resource.
Subpart (e):
Change in profit.
Subpart (e):
Explanation of Solution
The price would not change if the author were paid $3 million instead of $2 million, the publisher since there would be no change in marginal cost or marginal revenue. The result would be a fall in the firm’s profit.
Concept introduction:
Profit: Profit refers to the excess revenue after subtracting the total cost from the total revenue.
Subpart (f):
Maximize economic efficiency.
Subpart (f):
Explanation of Solution
To maximize economic efficiency, the publisher would charge the price at $10 per book. This is because it is the marginal cost of the book. At price $10 per book, the publisher would receive negative profits equal to the amount paid to the author.
Concept introduction:
Economic efficiency: Economic efficiency is the situation where the economy is efficient. Which means that the marginal benefit from the last unit produced is equal to the marginal cost of production and the economic surplus will be at maximum.
Want to see more full solutions like this?
Chapter 15 Solutions
Principles of Economics, 7th Edition (MindTap Course List)

- What is the maximum profit for individual pricingarrow_forwardA publisher has the following table of demand for the next novel by one of its famous authors: Price Number of novel in demand 100 0 90 1 80 2 70 3 60 4 50 5 40 6 30 7 20 8 10 9 0 10 The author is paid $2 to write the book (Fixed Cost or FC) and the marginal cost (MC) of publishing it is a constant $10 per book. a) Calculate the total revenue, total cost, and corresponding profits for each quantity. What quantity would a profit-maximizing publisher choose? What price would he set? b) Calculate marginal revenue. How does marginal revenue compare to price? Explain. c) Plot the marginal revenue (MR), marginal cost (MC), and demand (D) curves. At what quantity do the marginal revenue and marginal cost curves intersect? What does this mean? d) Obtain the economic profits (EP) of this monopolist and graph.arrow_forwardAngie Mae has just finished recording her latest CD. Her record company's marketing department determines that the demand for the CD is as follows: Marginal Revenue Price Number of Total CDs Revenue 24 10,000 22 20,000 20 30,000 18 40,000 16 50,000 14 60,000 1. Find total revenue for a quantity equal to 10,000, 20,000, and so on (write your answers on the third column of the table above). What is the marginal revenue for each 10,000 increase in the quantity sold (write your answers on the fourth column of the table above)? 2. What quantity of CDs would maximize profit? 3. What would be the price be? 4. What would be the profit be? 5. If you were Angie Mae's agent, what recording fee would you advise her to demand from the record company? Why?arrow_forward
- A friend has just started up her own business. Her firm asks you how much to charge for her product to maximize profits. The demand schedule for it is given by the first two columns in the table below; its total costs are given in the third column. For each level of output, you can calculate total revenue, marginal revenue, average cost, and marginal cost. The profit-maximizing level of output can be found at the point where TR - TC is greatest, or where MR = MC, (or the last quantity where MR is still greater than MC.) What is the profit-maximizing level of output for her product? 40 How much will she earn in profits? 80 Price Quantity TC TR? MR? MC? $25.00 0 $130 $24.00 10 $275 $23.00 20 $435 $22.50 30 $610 $22.00 40 $800 $21.60 50 $1,005 $21.20 60 $1,225arrow_forwardHenry Potter owns the only well in town that produces clean drinking water. He faces the following demand, marginal revenue, and marginal cost curves:Demand: P = 70 – QMarginal revenue: MR = 70 – 2QMarginal cost: MC = 10 + Qa) Graph these three curves. Assuming that Mr. Potter maximizes profit, what quantity does he produce? What price does he charge? Show these results on your graph.b) Mayor George Bailey, concerned about water consumers, is considering a price ceiling that is 10 percent below the monopoly price derived in part (a). What quantity would be demanded at this new price? Would the profit-maximizing Mr. Potter produce that amount? Explain. (Hint: Think about marginal cost.)c) George’s Uncle Billy says that a price ceiling is a bad idea because price ceilings cause shortages. Is he right in thiscase? What size shortage would the price ceiling create? Explain.d) George’s friend Clarence, who is even more concerned about consumers, suggests a price ceiling 50 percent below…arrow_forwardFor the following exercise, which has already been published previously, please you only need to answer question d) A publisher has the following table of demand for the next novel by one of its famous authors: Price Number of novel in demand 100 0 90 1 80 2 70 3 60 4 50 5 40 6 30 7 20 8 10 9 0 10 The author is paid $2 to write the book (Fixed Cost or FC) and the marginal cost (MC) of publishing it is a constant $10 per book. a) Calculate the total revenue, total cost, and corresponding profits for each quantity. What quantity would a profit-maximizing publisher choose? What price would he set? b) Calculate marginal revenue. How does marginal revenue compare to price? Explain. c) Plot the marginal revenue (MR), marginal cost (MC), and demand (D) curves. At what quantity do the marginal revenue and marginal cost curves intersect? What does this mean? d) Obtain the economic profits (EP) of this monopolist and graph.arrow_forward
- A small town with a movie theater has 300 adults and 200 seniors. The theater is considering putting on a special one-time screening of a new movie. This screening has a fixed cost of $2,000, but the marginal cost of selling an additional ticket is zero. According to a survey, all the adults and seniors would be willing to purchase the tickets at $7 and $4 respectively. a. What prices would the movie theater charge for an adult ticket and for a senior's ticket if it wanted to maximize profit? Explain and calculate the profit. b. Suppose a law is passed that prohibits the movie theater from charging different prices to adults and seniors. What price would it set for a ticket now? What is the profit? c. Who is worse off because of the law prohibiting price discrimination? Who is better off? d. If the fixed cost of the concert was $2,500 rather than $2,000, how would your answers to parts-(e) change?arrow_forwardO 1) R. 2) S. 3) U. 4) T. RSTU Quantity (per period)arrow_forwardWhy is the level of output at which marginal revenue equals marginal cost the profit-maximizing output?arrow_forward
- The following graph shows the daily demand curve for bippitybops in Detroit. Use the green rectangle (triangle symbols) to compute total revenue at various prices along the demand curve. Note: You will not be graded on any changes made to this graph. PRICE (Dollars per bippitybop) OTAL REVENUE (Dollars) 2400 1600 100 90 1200 80 1000 70 800 60 50 40 30 20 2200 + 10 2000 + 1800 + 0 1400 + Calculate the daily total revenue when the market price is $90, $80, $70, $60, $50, $40, $30, and $20 per bippitybop. Then, use the green point (triangle symbol) to plot the daily total revenue against quantity corresponding to these market prices on the following graph. (?) 0 ** B Demand 80 10 20 30 40 50 60 70 QUANTITY (Bippitybops per day) 90 100 Total Revenue A ? Total Revenuearrow_forwardThe following table contains different consumers' values for three software titles: PowerPoint, Excel, and Word. Suppose there are 100 consumers of each type. It costs Microsoft $0 to produce each piece of software. Consumer Types Administrative Assistants Marketing/Sales Accountants Price per each Profit on just that software PowerPoint Total profit on all software $76 $200 $25 A la carte pricing If Microsoft were to sell each of the software individually, what price should it set for each and what would its profits on each be? PowerPoint Excel $100 $100 $250 $ Word $200 $125 $25 Excel Word Bundled Pricing If Microsoft were to only sell the three products as a bundle, what price should they set for bundle and what would profits be? Bundled Price $ Total Profit S Mixed Pricing Suppose that Microsoft offered a bundle of all three for $375, but it also offers a price of $200 for each software separately. What is the new profit level for this pricing scheme?$ Is this mixed-pricing scheme…arrow_forwardKali is a dot-com entrepreneur who has established a Web site at which people can design and buy aring. Kali pays $600 a month for a Web server and Internet connection. The rings that customers design are made to order by another firm, and Kali pays this firm $20 a ring. Kali has no other costs. The table shows the demand schedule for Kali's rings. What is Kali's profit-maximizing output, price, and economic profit? Price (dollars per ring) 100 Quantity (rings per month) 0 80 20 60 40 40 60 20 80 0 100 Kali's profit-maximizing output is rings a month. Kali's profit-maximizing price is $ a ring. Kali's economic profit is $ a month.arrow_forward
 Essentials of Economics (MindTap Course List)EconomicsISBN:9781337091992Author:N. Gregory MankiwPublisher:Cengage Learning
 Microeconomics: Private and Public Choice (MindTa...EconomicsISBN:9781305506893Author:James D. Gwartney, Richard L. Stroup, Russell S. Sobel, David A. MacphersonPublisher:Cengage Learning