
Cornerstones of Financial Accounting
4th Edition
ISBN: 9781337690881
Author: Jay Rich, Jeff Jones
Publisher: Cengage Learning
expand_more
expand_more
format_list_bulleted
Concept explainers
Videos
Textbook Question
Chapter 12, Problem 72E
Horizontal Analysis of Income Statements
consolidated income statements for Winged Manufacturing follow.
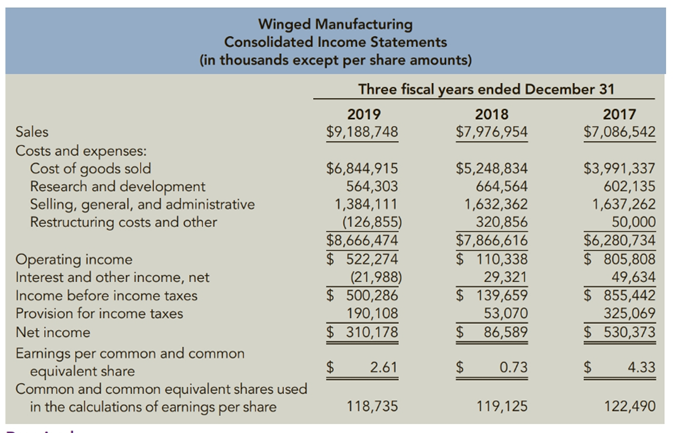
Required:
1. Prepare common size income statements for horizontal analysis (in percentage terms, rounded to two decimal places). You do not need to include the actual dollar amounts shown above.
2. CONCEPTUAL CONNECTION Explain why net income decreased in 2018 and increased in 2019.
Expert Solution & Answer

Trending nowThis is a popular solution!

Students have asked these similar questions
Performing horizontal analysis—income statement
Data for Mulberry Designs, Inc. follow:
Requirements
Prepare a horizontal analysis of the comparative income statement of Mulberry Designs, Inc. Round percentage changes to one decimal place.
Why did 2018 net income increase by a higher percentage than net sales revenue?
1. Solve the following ratios from year 2018-2020. Show complete solutions/computations.
-OPERATING MARGIN-BASIC EARNINGS POWER-PRICE EARNINGS RATIO
Using the information from 27A prepare the following ratios:
gross profit margin
profit margin
return on assets
earnings per share
current ratio
acid test ratio
debt ratio
Indicate what each is used for (ie: measuring efficiency, solvency etc)
Chapter 12 Solutions
Cornerstones of Financial Accounting
Ch. 12 - Describe how some of the primary groups of users...Ch. 12 - Prob. 2DQCh. 12 - Prob. 3DQCh. 12 - Prob. 4DQCh. 12 - Prob. 5DQCh. 12 - Prob. 6DQCh. 12 - Prob. 7DQCh. 12 - Prob. 8DQCh. 12 - Prob. 9DQCh. 12 - Prob. 10DQ
Ch. 12 - Prob. 11DQCh. 12 - 12. Why are higher asset turnover ratios...Ch. 12 - Prob. 13DQCh. 12 - Prob. 14DQCh. 12 - Prob. 15DQCh. 12 - Prob. 16DQCh. 12 - Which of the following use financial statement...Ch. 12 - Prob. 2MCQCh. 12 - Prob. 3MCQCh. 12 - Prob. 4MCQCh. 12 - Prob. 5MCQCh. 12 - Prob. 6MCQCh. 12 - Prob. 7MCQCh. 12 - Which type of analysis compares a single...Ch. 12 - Which of the following types of analysis compares...Ch. 12 - Which of the following types of analysis is...Ch. 12 - Prob. 11MCQCh. 12 - Prob. 12MCQCh. 12 - Prob. 13MCQCh. 12 - Partial information from Fabray Companys balance...Ch. 12 - Hummel Inc. has $30,000 in current assets and...Ch. 12 - Prob. 16MCQCh. 12 - A firms quick ratio is typically computed as: a....Ch. 12 - Prob. 18MCQCh. 12 - Prob. 19MCQCh. 12 - Prob. 20MCQCh. 12 - Prob. 21MCQCh. 12 - Prob. 22MCQCh. 12 - Prob. 23MCQCh. 12 - When analyzing a companys debt to equity ratio,...Ch. 12 - Prob. 25MCQCh. 12 - Prob. 26MCQCh. 12 - Prob. 27MCQCh. 12 - Prob. 28MCQCh. 12 - Prob. 29MCQCh. 12 - Prob. 30MCQCh. 12 - Which of the following ratios is used to measure...Ch. 12 - Prob. 32MCQCh. 12 - Selected information for Berry Company is as...Ch. 12 - Which of the following ratios is used to measure a...Ch. 12 - Prob. 35MCQCh. 12 - Prob. 36MCQCh. 12 - Prob. 37MCQCh. 12 - Prob. 38MCQCh. 12 - Which of the following are not part of common...Ch. 12 - Prob. 40MCQCh. 12 - Prob. 41MCQCh. 12 - Prob. 42MCQCh. 12 - Which of the following is not included in the...Ch. 12 - When a Dupont analysis reveals that a company has...Ch. 12 - Prob. 45MCQCh. 12 - Cross Sectional Analysis Cross sectional analysis...Ch. 12 - Prob. 47CECh. 12 - Prob. 48CECh. 12 - Short-Term Liquidity Ratios Three ratios...Ch. 12 - Debt Management Ratios Selected data from the...Ch. 12 - Debt Management and Short-Term Liquidity Ratios...Ch. 12 - Asset Efficiency Ratios Selected financial...Ch. 12 - Profitability Ratios The following data came from...Ch. 12 - Prob. 54CECh. 12 - Prob. 55CECh. 12 - Prob. 56CECh. 12 - Prob. 57BECh. 12 - Prob. 58BECh. 12 - Prob. 59BECh. 12 - Short-Term Liquidity Ratios Larry, Curly, and Moe...Ch. 12 - Debt Management Ratios Glow Corporation provides...Ch. 12 - Debt Management and Short-Term Liquidity Ratios...Ch. 12 - Asset Efficiency Ratios Rumsford Inc.s financial...Ch. 12 - Prob. 64BECh. 12 - Profitability Ratios Tinker Corporation operates...Ch. 12 - Profitability Ratios Katrina Corp. is a publicly...Ch. 12 - Prob. 67BECh. 12 - Prob. 68ECh. 12 - Prob. 69ECh. 12 - Prob. 70ECh. 12 - Prob. 71ECh. 12 - Horizontal Analysis of Income Statements...Ch. 12 - Prob. 73ECh. 12 - Prob. 74ECh. 12 - Prob. 75ECh. 12 - Prob. 76ECh. 12 - Prob. 77ECh. 12 - Prob. 78ECh. 12 - Prob. 79ECh. 12 - Asset Efficiency Ratios Refer to financial...Ch. 12 - Prob. 81ECh. 12 - Prob. 82ECh. 12 - Prob. 83ECh. 12 - Prob. 84PSACh. 12 - Prob. 85PSACh. 12 - Prob. 86PSACh. 12 - A Using Common Size Statements The following...Ch. 12 - Prob. 88PSACh. 12 - Prob. 89PSACh. 12 - Prob. 90PSACh. 12 - A Comparing Financial Ratios Presented below are...Ch. 12 - A Preparation of Ratios Refer to the financial...Ch. 12 - Accounting Alternatives and Financial Analysis...Ch. 12 - Prob. 84PSBCh. 12 - Prob. 85PSBCh. 12 - Prob. 86PSBCh. 12 - Prob. 87PSBCh. 12 - Prob. 88PSBCh. 12 - Prob. 89PSBCh. 12 - Prob. 90PSBCh. 12 - Comparing Financial Ratios Presented below are...Ch. 12 - Prob. 92PSBCh. 12 - Problem 1 2-93B Accounting Alternatives and...Ch. 12 - Prob. 94CCh. 12 - Prob. 95.1CCh. 12 - Prob. 95.2CCh. 12 - Prob. 96.1CCh. 12 - Prob. 96.2CCh. 12 - Prob. 97.1CCh. 12 - Prob. 97.2CCh. 12 - Prob. 97.3CCh. 12 - Prob. 97.4CCh. 12 - Analyzing Growth Consolidated financial statements...Ch. 12 - Analyzing Growth Consolidated financial statements...Ch. 12 - Prob. 98.1CCh. 12 - Prob. 98.2CCh. 12 - Prob. 98.3CCh. 12 - CONTINUING PROBLEM: FRONT ROW ENTERTAINMENT The...Ch. 12 - Prob. 99.2CCh. 12 - Prob. 99.3CCh. 12 - Prob. 99.4CCh. 12 - Prob. 99.5C
Knowledge Booster


Learn more about
Need a deep-dive on the concept behind this application? Look no further. Learn more about this topic, accounting and related others by exploring similar questions and additional content below.Similar questions
- The following select account data is taken from the records of Reese Industries for 2019. A. Use the data provided to compute net sales for 2019. B. Prepare a simple income statement for the year ended December 31, 2019. C. Compute the gross margin for 2019. D. Prepare a multi-step income statement for the year ended December 31, 2019.arrow_forwardA condensed income statement for Weber Associates and a partially completed vertical analysis follow. Required: 1. Complete the vertical analysis by computing each missing line item as a percentage of net revenues. TIP: In the prior year, Cost of Goods Sold was 31 percent of Net Revenues, computed as ($1,397 ÷ $4,571). 2. Does Cost of Goods Sold, as a percentage of Net Revenues, represent better or worse performance in 2019 as compared to 2018? Complete this question by entering your answers in the tabs below. Required 1 Required 2 Complete the vertical analysis by computing each missing line item as a percentage of net revenues. TIP: In the prior year, Cost of Goods Sold was 31 percent of Net Revenues, computed as ($1,397 ÷ $4,571). (Decreases should be indicated by a minus sign. Round your answers to the nearest whole percent.) Net Revenues Cost of Goods Sold Research and Development Expense Sales and Marketing Expense General and Administrative Expense Income from Operations Other…arrow_forwardRequired: (a) You are required to calculate the following ratios:(i) Gross profit margin(ii) Operating profit margin(iii) Expenses to sales(iv) Return on Capital Employed(v) Asset turnover(vi) Non-current asset turnover(vii) Current Ratio(viii) Quick Ratio(ix) Inventory days(x) Receivables days(xi) Payable days(xii) Interest cover (b) In light of your calculations comment on the performance of the company over thelast two years.arrow_forward
- Direction: Answer the problem below and forecasts the income statement using percent of sales method. (Please refer to the picture)arrow_forwardindicate whether the statement describes a multiple-step income statement or asingle-step income statement.a. Multiple-step income statement b. Single-step income statement Commonly reports detailed computations of net sales and other costs and expenses.arrow_forwardIncome statements for Campbell Company for Year 3 and Year 4 follow: CAMPBELL COMPANY Income Statements Year 4 Year 3 $180,800 120,400 19,900 14,500 Sales $200,800 Cost of goods sold Selling expenses Administrative expenses Interest expense Total expenses 142,400 21,900 12,500 3,900 $180,700 5,900 $160,700 20,100 3,700 Income before taxes 20,100 Income taxes expense 6,500 Net income $ 13,600 $ 16,400 Required a. Perform a horizontal analysis, showing the percentage change in each income statement component between Year 3 and Year 4. b. Perform a vertical analysis, showing each income statement component as a percentage of sales for each year. Complete this question by entering your answers in the tabs below. Required A Required B Perform a horizontal analysis, showing the percentage change in each income statement component between Year 3 and Year 4. (Negative answers should be indicated by a minus sign. Round your percentage answers to 1 decimal place. (i.e., 0.234 should be entered…arrow_forward
- Which of the following is a technique for reviewing relationships on an income statement by assigning net sales as 100%? A. Ratio analysis. B. Current ratio. C. Horizontal analysis. D. Vertical analysis.arrow_forwardWhen performing vertical analysis of an income statement, the base amount is ________. A sales revenue B total expenses C gross profit D net incomearrow_forward6. The following is the adjusted trial balance data for Nino's Pizzenia as of December 31, 2019. NINO'S PIZZERIA Adjusted Trlal Balance Year Ended December 31,2019 Debit Credit S 775,984 45,688 200,460 135,624 Cash Accounts Receivable Buildings Merchandise Inventory Accounts Payable Common Stock Sales Interest Revenue Rent Revenue Sales Salaries Expense office Supplies Expense Sales Discounts Interest Expense Sales Returns and Allowances, Cost of goods sold Rent Expense Depreciation Expense: Office Equipment Insurance Expense Advertising Expense Totals $437,880 410,542 555,696 84,652 86,900 24,500 6,270 102,890 4,577 105.854 122,853 20.000 10.555 2,780 17:635 $1,575,670 $1,575,670arrow_forward
- VII. Direction: Compute and interpret. The following comparative financial statements are provided by Avatar Industries. You were asked to compute the different financial ratios and provide your interpretations with regards to profitability, efficiency, liquidity and solvency of the company. Use the Answer Sheet template below to input your answer and solution. AVATAR INDUSTRIES AVATAR INDUSTRIES Comparative Statement of Financial Position For the years 2019 and 2018 Comparative Income Statement For the years 2019 and 2018 2019 2018 2019 2018 ASSETS Current Assets: Sales P200,000 P210,000 Cash & Cash Equivalent P65,000 P70,000 Sales Returns and Allowances 40,000 25,000 Accounts Receivable 40,000 35,000 Net Sales 160,000 185,000 Marketable Securities 40,000 35,000 Cost of Goods Sold 100,000 115,625 Inventory 100,000 80,000 Gross Profit 60,000 69,375 Total Current Assets 245,000 220,000 Operating Expenses: Fixed Assets 200,000 160,000 Selling Expenses 22,000 25,000 Total Assets P445,000…arrow_forwardGiven the following income statement information, what percentage would appear for selling expenses in a vertical analysis?arrow_forwardComparative Income Statement Use the following comparative income statement form to enter amounts you identify from the computations on the Liquidity and Solvency Measures part and on the Profitability Measures part. Compute any missing amounts and complete the horizontal analysis columns. Enter percentages as decimal amounts, rounded to one decimal place. When rounding, look only at the figure to the right of one decimal place. If 5, round up. For example, for 32.048% enter 32.0%. For 32.058% enter 32.1%. Sales Cost of goods sold Gross profit Selling expenses Administrative expenses Total operating expenses Operating income Other expense (interest) Income before income tax expense Income tax expense Net income Comparative Income Statement For the Years Ended December 31, 20Y6 and 20Y5 $ 20Y6 8,250,000 X (1,242,000) 20Y5 $7,287,000 (3,444,000) $3,843,000 $(1,457,600) (1,106,000) $(2,563,600) $1,279,400 (120,600) $1,158,800 (181,980) $976,820 $ $ $ Increase/(Decrease) Amount 823,000 X…arrow_forward
arrow_back_ios
SEE MORE QUESTIONS
arrow_forward_ios
Recommended textbooks for you
 Cornerstones of Financial AccountingAccountingISBN:9781337690881Author:Jay Rich, Jeff JonesPublisher:Cengage Learning
 Survey of Accounting (Accounting I)AccountingISBN:9781305961883Author:Carl WarrenPublisher:Cengage Learning
 Century 21 Accounting Multicolumn JournalAccountingISBN:9781337679503Author:GilbertsonPublisher:Cengage
 Managerial Accounting: The Cornerstone of Busines...AccountingISBN:9781337115773Author:Maryanne M. Mowen, Don R. Hansen, Dan L. HeitgerPublisher:Cengage LearningPrinciples of Accounting Volume 1AccountingISBN:9781947172685Author:OpenStaxPublisher:OpenStax College
Cornerstones of Financial Accounting
Accounting
ISBN:9781337690881
Author:Jay Rich, Jeff Jones
Publisher:Cengage Learning
Survey of Accounting (Accounting I)
Accounting
ISBN:9781305961883
Author:Carl Warren
Publisher:Cengage Learning
Century 21 Accounting Multicolumn Journal
Accounting
ISBN:9781337679503
Author:Gilbertson
Publisher:Cengage
Managerial Accounting: The Cornerstone of Busines...
Accounting
ISBN:9781337115773
Author:Maryanne M. Mowen, Don R. Hansen, Dan L. Heitger
Publisher:Cengage Learning
Principles of Accounting Volume 1
Accounting
ISBN:9781947172685
Author:OpenStax
Publisher:OpenStax College
What is variance analysis?; Author: Corporate finance institute;https://www.youtube.com/watch?v=SMTa1lZu7Qw;License: Standard YouTube License, CC-BY