
a)
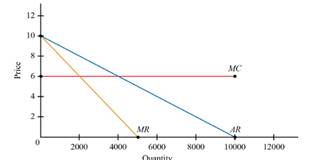
To Draw: the graph for demand, marginal cost, and marginal revenue curves.
a)
Answer to Problem 12.2P
Explanation of Solution
Given Figure
Given demand is
Marginal cost is constant at
Marginal revenue curve=
The above figure shows that demand curve, marginal cost curve and marginal revenue.
One of the negatively sloped curve is demand Curve. Also the marginal revenue curve is negatively sloped and twice vertically than the demand curve. The marginal cost is fixed and finally marginal cost is horizontal.
Introduction:
When the produced quantity is added by one whenever changes occur in the whole cost is called marginal cost. Suppose many number of goods are produced that time the marginal cost will be increased unit by unit.
One of another revenue that would be generated by product sales when increasing with one unit is called market revenue. It’s defined by divide the changes in total revenue and changes in output quantity.
b)
To Calculate: the price and quantity associated with Point C, the
b)
Answer to Problem 12.2P
Industry Profit is
Consumer Surplus is
Social Welfare is
Explanation of Solution
Given Figure

Given demand is
Marginal cost is constant at
Marginal revenue curve=
When the Price equals marginal cost, i.e.)
The price level of
Thus, when the competitive equilibrium C, the quantity level is
The total revenue
The marginal cost is constant at
The total cost
Thus, the total revenue and total cost are equal, the industry profit is
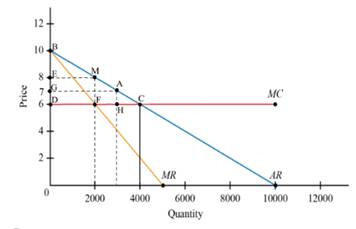
The consumer surplus equals to the area of triangle BCD.
Area of triangle
Consumer Surplus
Social welfare= Consumer surplus +Industry Profit
Introduction:
c)
To Calculate: the price and quantity associated with point M, the
c)
Answer to Problem 12.2P
Industry Profit is
Consumer Surplus is
Social Welfare is
Deadweight loss is
Explanation of Solution
Given Figure

Given demand is
Marginal cost is constant at
Marginal revenue curve=
The monopoly outcome M, the quantity level is
The total revenue
The marginal cost is constant at
The total cost
Thus, the total revenue and total cost are
The industry profit is
The consumer surplus equals to the area of triangle BME.
Area of triangle
Consumer Surplus
Social welfare= Consumer surplus +Industry Profit
Deadweight Loss=Social welfare at competitive equilibrium - social welfare at the monopoly outcome
Introduction: One kind of firms are having formal agreement for collusion to produce the trademark output and sell in the trademark price is generally known as cartel. Extreme type of perfect collusion is called Perfect cartel. Through this, firms producing a different homogeneous product to make the centralized product.
d)
To Calculate: the price and quantity associated with point A, a hypothetical imperfectly competitive outcome, it lies at a price halfway between C and M and also compute industry profit, consumer surplus, social welfare and deadweight loss.
d)
Answer to Problem 12.2P
Industry Profit is
Consumer Surplus is
Social Welfare is
Deadweight loss is
Explanation of Solution
Given Figure
Given demand is
Marginal cost is constant at
Marginal revenue curve=
When the Price equals marginal cost, i.e.)
The price level of
The outcome A, the quantity level is
The total revenue
The marginal cost is constant at
The total cost
Thus, the total revenue and total cost are
The industry profit is
The consumer surplus equals to the area of triangle BAG.
Area of triangle
Consumer Surplus
Social welfare= Consumer surplus +Industry Profit
Deadweight Loss=Social welfare at competitive equilibrium - social welfare at the outcome A
Introduction: imperfectly competition occurs in a market suppose one of the conditions are left or unmet with perfectly competition. This kind of market is generally very common. Here products and services and prices are not set by supply and demand.
Want to see more full solutions like this?
Chapter 12 Solutions
EBK INTERMEDIATE MICROECONOMICS AND ITS

- Refer to Figure 13.1. Suppose demand is Q = 10000 - 1000P and marginal cost is constant at MC=6. From the given demand curve, one can compute the following marginal revenue curve: MR = 10 - Q/500 a. Graph the demand, marginal cost, and marginal revenue curves. b. Calculate the price and quantity associated with point C, the perfectly competitive outcome. Compute industry profit, consumer surplus, and social welfare. c. Calculate the price and quantity associated with point M, the monopoly/perfect cartel outcome. Compute industry profit, consumer surplus, social welfare, and deadweight loss. d. Calculate the price and quantity associated with point A, a hypothetical imperfectly competitive outcome, assuming that it lies at a price halfway between C and M.Compute industry profit, consumer surplus, social welfare, and deadweight loss.arrow_forwardThe figure shows the market demand curve for penicillin, an antibiotic medicine. Initially, the market was supplied by perfectly competitive firms. Later, the government granted the exclusive right to produce and sell penicillin to one firm. The figure also shows the marginal revenue curve (MR) of the firm once it begins to operate as a monopoly. The marginal cost is constant at $3. irrespective of the market structure. After the market changes from perfect competition to a monopoly.. OA. social surplus decreases OB. consumer surplus increases. OC. deadweight loss decreases OD. the market price decreases -COD- Price/Cost (5) 10 9 10 20 30 MR 40 60 00 Demand 70 BO so Quanety (units)arrow_forwardQuestion 4: The ethanol industry is perfectly competitive, and each producer has the long-run marginal cost function MC(Q) = 48 - 24Q +3Q². The corresponding long-run average cost function is AC(Q) = 48 12Q+Q². The market demand curve for ethanol is QP = 240 - 10P. - 5. What is the equilibrium quantity demanded in this market? How many active producers are in the ethanol market in a long-run competitive equilibrium?arrow_forward
- Below is the demand schedule for wholesale pallets of ice cream. Assume that the marginal cost of supplying a wholesale pallet of ice cream is a flat $40 per pallet. Price Quantity Total Revenue Total Cost Profit $100 40 $90 50 $80 60 $70 70 $60 80 $50 90 $40 100 First, complete the table above for TR, TC, and profit. If this were a competitive industry, where P=MC, what would be the price and quantity of wholesale ice cream? If ice cream were supplied instead by a profit-maximizing monopoly, what would be the price and quantity? If Ben and Jerry were to form a collusive duopoly for the production of ice cream, what would be the price and industry quantity? If Ben and Jerry split the market in d. evenly, what would be the output and profit for each of them? What if Ben were to cheat on the cartel and produce a higher output by 10 pallets: What is Ben’s resulting output…arrow_forwardRefer to Figure 1 for questions 18-20. In Figure 1: D = Demand Curve; MR = Marginal Revenue Curve; and MC = LRATC is Marginal Cost, assumed to be equal to Long Run Average Total Cost. What is the competitive output and price for this market? Options: a) P = $3, Q = 7 b) P = $6, Q = 4 c) P = $3, Q = 4 d) P = $6, Q = 7arrow_forwardQuestion 4: The ethanol industry is perfectly competitive, and each producer has the long-run marginal cost function MC(Q) = 48 - 24Q +3Q². The corresponding long-run average cost function is AC(Q) = 48 12Q+Q². The market demand curve for ethanol is QP = 240 - 10P. 4. What is the long-run industry (or market) supply curve? 5. What is the equilibrium quantity demanded in this market? How many active producers are in the ethanol market in a long-run competitive equilibrium?arrow_forward
- Show a firm that is earning zero economic profits, but has some market power. Then, assume this market power is entirely eliminated when a new competitor enters the market with the same technology and produces a perfect substitute. Showing in your diagram how the firm must adjust its production level to most effectively compete with the new entering firm, explain why maintaining competition is important.arrow_forwardIn a perfectly competitive market, one of the following answers is correct with respect to the demand curve for a perfectly competitive firm. Which one? Group of answer choices The perceived demand curve is downward sloping. The perceived demand curve for a perfectly competitive firm and a monopolist look the same. When price increases, quantity demanded from the firm will also decrease. The demand curve is flat. Answer correct and explain within 40 mins will give you positive feedback.arrow_forwardThe figure depicts the demand curve of a firm producing cars, together with its marginal cost, average cost, and isoprofit curves. Based on the figure, which of the following statements is correct? Price, MC ($) 8,000 5,400 4,100 2,820 100 0 0 34 50 Quantity of cars, Q MC Isoprofit AC 100 O The consumer surplus in the profit-maximizing outcome is $105,300. The producer surplus in the Pareto efficient outcome is $133,960. O The deadweight loss in the profit-maximizing outcome is $20,640. O The firm's profit in the Pareto efficient outcome is $100,000.arrow_forward
- If the price is P, the firm in a perfectly competitive market is making a profit when producing the profit maximizing quantity Q1. Why would this situation lead to new entrants? Why would this increase in the number of firms competing in the market lead this firm to reduce output to Q (depicted in the right panel)? INDUSTRY S S¹ FIRM Costs - Revenue MC ATC K P P AR = MR ــة p1 Q Q¹ Use the editor to format your answer Outputarrow_forwardSuppose that each firm in a competitive industry has the following costs: Total Cost: TC=50+12q2TC=50+12q2 Marginal Cost: MC=qMC=q where qq is an individual firm's quantity produced. The market demand curve for this product is: Demand QD=140−2PQD=140−2P where PP is the price and QQ is the total quantity of the good. Each firm's fixed cost is . What is each firm's variable cost? 50+12q50+12q 12q12q qq 12q212q2 Which of the following represents the equation for each firm's average total cost? 50q+12q50q+12q 50q50q 50+12q50+12q 12q12q Complete the following table by computing the marginal cost and average total cost for qq from 5 to 15. q Marginal Cost Average Total Cost (Units) (Dollars) (Dollars) 5 12.50 6 11.33 7 10.64 8 10.25 9 10.06 10 10.00 11 10.05 12 10.17 13 10.35 14 10.57…arrow_forwardThe graph below shows a competitive firm's demand and cost curves. Assume that the firm produces at the profit-maximizing output level. What is the firm's profit? [Recall that in perfect competition a firm’s demand curve is a horizontal line drawn at the market price level and that P=MR=D.] Group of answer choices $144 $720 $576arrow_forward
 Managerial Economics: A Problem Solving ApproachEconomicsISBN:9781337106665Author:Luke M. Froeb, Brian T. McCann, Michael R. Ward, Mike ShorPublisher:Cengage Learning
 Microeconomics: Private and Public Choice (MindTa...EconomicsISBN:9781305506893Author:James D. Gwartney, Richard L. Stroup, Russell S. Sobel, David A. MacphersonPublisher:Cengage Learning
 Economics: Private and Public Choice (MindTap Cou...EconomicsISBN:9781305506725Author:James D. Gwartney, Richard L. Stroup, Russell S. Sobel, David A. MacphersonPublisher:Cengage Learning