Concept explainers
Videos
Returns and Standard Deviations Consider the following information:
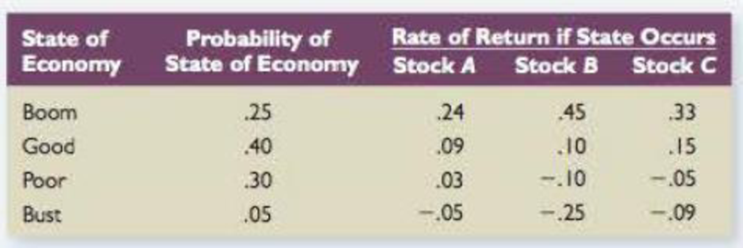
- a. Your portfolio is invested 30 percent each in A and C, and 40 percent in B. What is the expected return of the portfolio?
- b. What is the variance of this portfolio? The standard deviation?
a.
To determine: The Expected Return on Portfolio.
Introduction: Expected Return is a process of estimating the profits and losses an investor earns through the expected rate of returns. Standard deviation is apportioned of distribution of a collection of figures from its mean.
Answer to Problem 9QP
Solution: The Expected Return on Portfolio is 11.17%
Explanation of Solution
Determine the Portfolio Return for each Stock
Therefore the Portfolio Return for Boom is 35.10%, Good is 11.20%, Poor is -4.60% and Bust is -14.20%.
Determine the Expected Return on Portfolio
Therefore the Expected Return on Portfolio is 11.17%.
b.
To determine: The Variance and Standard Deviation on Portfolio.
Answer to Problem 9QP
Solution: The Variance on Portfolio is 0.025 and Standard Deviation on Portfolio is 15.81%.
Explanation of Solution
Determine the Variance of Portfolio
Therefore the Variance on Portfolio is 0.025.
Determine the Standard Deviation of Portfolio
Therefore the Standard Deviation on Portfolio is 15.81%.
Want to see more full solutions like this?
Chapter 11 Solutions
Corporate Finance (The Mcgraw-hill/Irwin Series in Finance, Insurance, and Real Estate)


- Portfolio Suppose rA ~ N (0.05, 0.01), rB ~ N (0.1, 0.04) with pA,B = 0.2 where rA and rB are CCR’s. a) Suppose you construct a portfolio with 50% for A and 50% for B. Find the variance of the portfolio CCR. b) Find the portfolio expected gross return. c) Find the expected portfolio CCR.arrow_forwardWhat are the (a) expected return, (b) standard deviation, and (c) coefficient of variation for an investment with the following probability distribution? Probability Payoff 0.2 19.0% 0.7 9.0 0.1 4.0arrow_forwardFollowing is the portfolio weights, w, percentage expected return in (%), R, vectors and variance-covariance matrix, VC, for a three-asset portfolio: 0.4 12 100 -45 10 w = [0.3], R = [10] and VC = [-45 64 10] 0.3 8 10 10 36 a. Calculate the expected return and standard deviation of the portfolio. b. Suppose an investor requires a target standard deviation of 4% for the portfolio; using the solver function in Excel, find the portfolio weights w to maximise the expected return subject to the constraints Op = 4 and wi + w2 + w3 = 1|arrow_forward
- Compute the residual risk measure for portfolio A. Round off your final answer to three digits after the decimal point. Compute the appraisal ratio for portfolio B. Round off your final answer to three digits after the decimal point.arrow_forwardWhat is the expected return on a two asset portfolio and what are its variance and standard deviation? Also, What is R squared?arrow_forwardCalculate the (a) expected return, (b) standard deviation, and (c) coefficient of variation for an investment with the following probability distribution: Probability Payoff 0.45 32.0% 0.35 -4.0% 0.20 -20.0%arrow_forward
- Portfolios A and B are both well-diversified. The risk-free rate is 8%. The return for the market is 10%. Portfolio A has an expected return of 15% and beta of 1.1. Portfolio B has an expected return of 9% and beta of 0.20. Portfolio A's variance is 9%, whilst Portfolio B's variance is 5.5%. Calculate for Portfolio A and Portfolio B the following: 1. Sharpe's Measure, 2. Treynor's Measure, 3. Jensen's Measure. Which is the better portfolio according to each measure?arrow_forwardPossible returns and their probabilities for an asset is given in the table below. The expected return is 30.25%. Calculate the standard deviation of the asset's return. Probability 0.40 0.45 0.15 13.92% O 17.84 % 18.55% O 19.09% 16.59% Return 0.52 0.17 0.12arrow_forwardAn investiment portfolio consists of two securities, X and Y. The weight of X is 30%. Asset X's expected return is 15% and the standard deviation is 28%. Asset Y's expected return is 23% and the standard deviation is 33%. Assume the correlation coefficient between X and Y is 0.37. A. Calcualte the expected return of the portfolio. B. Calculate the standard deviation of the portfolio return. C. Suppose now the investor decides to add some risk free assets into this portfolio. The new weights of X, Y and risk free assets are 0.21, 0.49 and 0.30. What is the standard deviation of the new portfolio?arrow_forward
- Asset K has an expected return of 10 percent and a standard deviation of 28 percent. Asset L has an expected return of 7 percent and a standard deviation of 18 percent. The correlation between the assets is .40. What are the expected return and standard deviation of the minimum variance portfolio?arrow_forwardExpected retun and standard deviation. Use the following information to answer the questions: a. What is the expected return of each asset? b. What is the variance and the standard deviation c. What is the expected return of a portfolio with 1 1 Data Table d. What is the portfolio's variance and standard de - X Hint Make sure to round all intermediate calculatio Swers yo (Click on the following icon D in order to copy its contents into a spreadsheet.) a. What is the expected return of asset J? (Round to four decimal places.) Return on Return on Return on Probability of State State of Asset J in Asset Kin State 0.200 0.140 0.040 Asset L in Economy State State Вoom 0.28 0.070 0.260 0.180 Growth 0.37 0.25 0.070 Stagnant 0.070 0.060 -0.210 Recession 0.10 0.070 -0.100 Print Donearrow_forwardAssuming the following returns and corresponding probabilities for Asset D: Rate of Return Probability 10% 30% 15% 40% 20% 30% Compute for: a. Expected rate of return b. The standard deviation c. The coefficient of variationarrow_forward
 Essentials Of InvestmentsFinanceISBN:9781260013924Author:Bodie, Zvi, Kane, Alex, MARCUS, Alan J.Publisher:Mcgraw-hill Education,

 Foundations Of FinanceFinanceISBN:9780134897264Author:KEOWN, Arthur J., Martin, John D., PETTY, J. WilliamPublisher:Pearson,
 Fundamentals of Financial Management (MindTap Cou...FinanceISBN:9781337395250Author:Eugene F. Brigham, Joel F. HoustonPublisher:Cengage Learning
 Corporate Finance (The Mcgraw-hill/Irwin Series i...FinanceISBN:9780077861759Author:Stephen A. Ross Franco Modigliani Professor of Financial Economics Professor, Randolph W Westerfield Robert R. Dockson Deans Chair in Bus. Admin., Jeffrey Jaffe, Bradford D Jordan ProfessorPublisher:McGraw-Hill Education