
Survey of Accounting (Accounting I)
8th Edition
ISBN: 9781305961883
Author: Carl Warren
Publisher: Cengage Learning
expand_more
expand_more
format_list_bulleted
Videos
Textbook Question
Chapter 11, Problem 6CDQ
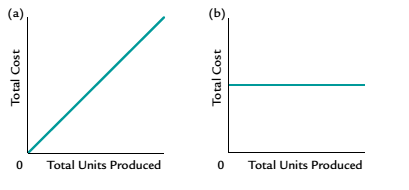
Which of the following graphs illustrates how total fixed costs be have with changes in total units produced
Expert Solution & Answer

Trending nowThis is a popular solution!

Students have asked these similar questions
Which of the following best describes a fixed cost?
a.Cost representing a fixed proportion of total costs
b.Cost directly related to output
c.Cost that remains at the same level up to a particular level of output .
d.Cost that remains at the same level when output increases.
Can you label revenue, loss, total costs, dollars, variable cost, and fixed cost on the provided chart?
What formula is used to calculate fixed cost and variable cost per unit? Explain with an example.
Chapter 11 Solutions
Survey of Accounting (Accounting I)
Ch. 11 - Which of the following statements describes...Ch. 11 - If sales are $500,000, variable costs are...Ch. 11 - If the unit selling price is $16. the unit...Ch. 11 - Based on the data presented in Question 3, how...Ch. 11 - Prob. 5SEQCh. 11 - Describe how total variable costs and unit...Ch. 11 - How would each of the following costs be...Ch. 11 - Describe the behavior of (a) total fixed costs and...Ch. 11 - How would each of the following costs be...Ch. 11 - In cost analyses, how arc mixed costs treated?
Ch. 11 - Which of the following graphs illustrates how...Ch. 11 - Which of the following graphs illustrates how unit...Ch. 11 - Which of the following graphs best illustrates...Ch. 11 - In applying the high-low method of Cost...Ch. 11 - Prob. 10CDQCh. 11 - Prob. 11CDQCh. 11 - Prob. 12CDQCh. 11 - If insurance rates are increased, what effect will...Ch. 11 - Prob. 14CDQCh. 11 - The reliability of cost-volume-profit (CVP)...Ch. 11 - How does the sales mix affect the calculation of...Ch. 11 - Prob. 17CDQCh. 11 - Classify costs Following is a list of various...Ch. 11 - Identify cost graphs The following cost graphs...Ch. 11 - Prob. 11.3ECh. 11 - Identify activity bases From the following list of...Ch. 11 - Identify fixed and variable costs Intuit Inc....Ch. 11 - Relevant range and fixed and variable costs Third...Ch. 11 - High-low method Liberty Inc. has decided to use...Ch. 11 - High-low method for service company Miss River...Ch. 11 - Contribution margin ratio a. Matzinger Company...Ch. 11 - Contribution margin and contribution margin ratio...Ch. 11 - Break-even sales and sales to realize operating...Ch. 11 - Prob. 11.12ECh. 11 - Prob. 11.13ECh. 11 - Break-even analysis The Garden Club of Palm...Ch. 11 - Break-even analysis Media outlets such as ESPN and...Ch. 11 - Prob. 11.16ECh. 11 - Prob. 11.17ECh. 11 - Prob. 11.18ECh. 11 - Prob. 11.19ECh. 11 - Prob. 11.20ECh. 11 - Break-even sales and sales mix for a service...Ch. 11 - Operating leverage SunRise Inc. and SunSet Inc....Ch. 11 - Classify costs Peak Apparel Co. manufactures a...Ch. 11 - Break-even sales under present and proposed...Ch. 11 - Prob. 11.2.2PCh. 11 - Prob. 11.2.3PCh. 11 - Prob. 11.2.4PCh. 11 - Prob. 11.2.5PCh. 11 - Break-even sales under present and proposed...Ch. 11 - Prob. 11.2.7PCh. 11 - Prob. 11.2.8PCh. 11 - Break-even sales and cost-volume-profit graph For...Ch. 11 - Prob. 11.3.2PCh. 11 - Break-even sales and cost-volume-profit graph For...Ch. 11 - Prob. 11.3.4PCh. 11 - Prob. 11.4.1PCh. 11 - Prob. 11.4.2PCh. 11 - Prob. 11.4.3PCh. 11 - Prob. 11.4.4PCh. 11 - Prob. 11.5.1PCh. 11 - Prob. 11.5.2PCh. 11 - Sales mix and break-even sales Data related to the...Ch. 11 - Prob. 11.5.4PCh. 11 - Prob. 11.5.5PCh. 11 - Contribution margin, break-even sales,...Ch. 11 - Contribution margin, break-even sales,...Ch. 11 - Contribution margin, break-even sales,...Ch. 11 - Contribution margin, break-even sales,...Ch. 11 - Contribution margin, break-even sales,...Ch. 11 - Margin of safety a. If Go-Go Buggies Company, with...Ch. 11 - Prob. 11.2MBACh. 11 - Margin of safety Use the data from E11-12 and...Ch. 11 - Margin of safety Use the data from E11-12 and...Ch. 11 - Sales mix and margin of safety Use the data from...Ch. 11 - Prob. 11.4.2MBACh. 11 - Prob. 11.4.3MBACh. 11 - Margin of safety Using the data from P11-2,...Ch. 11 - Prob. 11.5.2MBACh. 11 - Margin of safety Using the data from P11-6....Ch. 11 - Prob. 11.6.2MBACh. 11 - Prob. 11.6.3MBACh. 11 - Prob. 11.1CCh. 11 - Break-even sales, contribution margin "Every...Ch. 11 - Break-even analysis Aquarius Games Inc. has...Ch. 11 - Variable costs and activity bases in decision...Ch. 11 - Variable costs and activity bases in decision...Ch. 11 - Prob. 11.6C
Knowledge Booster


Learn more about
Need a deep-dive on the concept behind this application? Look no further. Learn more about this topic, accounting and related others by exploring similar questions and additional content below.Similar questions
- In the cost equation Y=a+bx, Y represents which of the following? A. fixed costs B. variable costs C. total costs D. units of productionarrow_forwardWhich of the following graphs illustrates how unit variable costs behave with changes in total units produced?arrow_forwardDescribe how total fixed costs and unit fixed costs behave with changes in the level of activity.arrow_forward
- The “fixed cost per unit function” may also be described as: a.an asymptote b.the total cost line c.the total variable cost line d.the total fixed cost linearrow_forwardQuestion Content Area Which of the following graphs in Figure 1 illustrates the behavior of a total variable cost?arrow_forwardA cost which changes in proportion to changes in volume of activity is called a: * a. fixed cost b. controllable cost c. variable cost d. opportunity costarrow_forward
- Total cost is a combination of fixed and variable costs. The algebraic equation, where T = totalcosts, v = variable costs, x = units produced, and f = fixed costs, for total cost isarrow_forwardWhich of the following is a carefully predetermined cost that is usually expressed on a per unit of output basis? applied cost standard cost flexible cost allocated costarrow_forward2. The following total cost graphs indicate which type of cost behavior? A. VARIABLE COST B. FIXED COST C. MIXED COST D. STEP COSTarrow_forward
arrow_back_ios
SEE MORE QUESTIONS
arrow_forward_ios
Recommended textbooks for you
 Survey of Accounting (Accounting I)AccountingISBN:9781305961883Author:Carl WarrenPublisher:Cengage Learning
 Principles of Accounting Volume 2AccountingISBN:9781947172609Author:OpenStaxPublisher:OpenStax College
 Managerial AccountingAccountingISBN:9781337912020Author:Carl Warren, Ph.d. Cma William B. TaylerPublisher:South-Western College Pub
 Financial And Managerial AccountingAccountingISBN:9781337902663Author:WARREN, Carl S.Publisher:Cengage Learning,
 AccountingAccountingISBN:9781337272094Author:WARREN, Carl S., Reeve, James M., Duchac, Jonathan E.Publisher:Cengage Learning,
 Accounting (Text Only)AccountingISBN:9781285743615Author:Carl Warren, James M. Reeve, Jonathan DuchacPublisher:Cengage Learning
Survey of Accounting (Accounting I)
Accounting
ISBN:9781305961883
Author:Carl Warren
Publisher:Cengage Learning
Principles of Accounting Volume 2
Accounting
ISBN:9781947172609
Author:OpenStax
Publisher:OpenStax College
Managerial Accounting
Accounting
ISBN:9781337912020
Author:Carl Warren, Ph.d. Cma William B. Tayler
Publisher:South-Western College Pub
Financial And Managerial Accounting
Accounting
ISBN:9781337902663
Author:WARREN, Carl S.
Publisher:Cengage Learning,
Accounting
Accounting
ISBN:9781337272094
Author:WARREN, Carl S., Reeve, James M., Duchac, Jonathan E.
Publisher:Cengage Learning,
Accounting (Text Only)
Accounting
ISBN:9781285743615
Author:Carl Warren, James M. Reeve, Jonathan Duchac
Publisher:Cengage Learning
How to Estimate Project Costs: A Method for Cost Estimation; Author: Online PM Courses - Mike Clayton;https://www.youtube.com/watch?v=YQ2Wi3Jh3X0;License: Standard Youtube License