
Concept explainers
To determine: The difference shown by the second set of sample from the first one.
Introduction
Company TT is a division of company DM. It was about to launch a new product. Ms. MY, the
Table 1
| Sample | Mean | Range |
| 1 | 45.01 | 0.85 |
| 2 | 44.99 | 0.89 |
| 3 | 45.02 | 0.86 |
| 4 | 45 | 0.91 |
| 5 | 45.04 | 0.87 |
| 6 | 44.98 | 0.9 |
| 7 | 44.91 | 0.86 |
| 8 | 45.04 | 0.89 |
| 9 | 45 | 0.85 |
| 10 | 44.97 | 0.91 |
| 11 | 45.11 | 0.84 |
| 12 | 44.96 | 0.87 |
| 13 | 45 | 0.86 |
| 14 | 44.92 | 0.89 |
| 15 | 45.06 | 0.87 |
| 16 | 44.94 | 0.86 |
| 17 | 45 | 0.85 |
| 18 | 45.03 | 0.88 |
Quiet disappointed with the end results, the manager was figuring out ways to improve the process and free the capital expenditure of $10,000. A former professor suggested going for more samples with less sample sizes. JM conducted the analysis on 27 samples of 5 observations each and the results are tabulated below:
Table 2
| Sample | Mean | Range |
| 1 | 44.96 | 0.42 |
| 2 | 44.98 | 0.39 |
| 3 | 44.96 | 0.41 |
| 4 | 44.97 | 0.37 |
| 5 | 45.02 | 0.39 |
| 6 | 45.03 | 0.4 |
| 7 | 45.04 | 0.39 |
| 8 | 45.02 | 0.42 |
| 9 | 45.08 | 0.38 |
| 10 | 45.12 | 0.4 |
| 11 | 45.07 | 0.41 |
| 12 | 45.02 | 0.38 |
| 13 | 45.01 | 0.41 |
| 14 | 44.98 | 0.4 |
| 15 | 45 | 0.39 |
| 16 | 44.95 | 0.41 |
| 17 | 44.94 | 0.43 |
| 18 | 44.94 | 0.4 |
| 19 | 44.87 | 0.38 |
| 20 | 44.95 | 0.41 |
| 21 | 44.93 | 0.39 |
| 22 | 44.96 | 0.41 |
| 23 | 44.99 | 0.4 |
| 24 | 45 | 0.44 |
| 25 | 45.03 | 0.42 |
| 26 | 45.04 | 0.38 |
| 27 | 45.03 | 0.4 |
Answer to Problem 2.2CQ
Explanation of Solution
Given information:
Table 3
| Sample | Mean | Range |
| 1 | 45.01 | 0.85 |
| 2 | 44.99 | 0.89 |
| 3 | 45.02 | 0.86 |
| 4 | 45 | 0.91 |
| 5 | 45.04 | 0.87 |
| 6 | 44.98 | 0.9 |
| 7 | 44.91 | 0.86 |
| 8 | 45.04 | 0.89 |
| 9 | 45 | 0.85 |
| 10 | 44.97 | 0.91 |
| 11 | 45.11 | 0.84 |
| 12 | 44.96 | 0.87 |
| 13 | 45 | 0.86 |
| 14 | 44.92 | 0.89 |
| 15 | 45.06 | 0.87 |
| 16 | 44.94 | 0.86 |
| 17 | 45 | 0.85 |
| 18 | 45.03 | 0.88 |
Formula:
Mean Chart:
Difference shown by the second set of sample from the first one:
Date set:1
Table 4
| Sample | Mean | Range |
| 1 | 45.01 | 0.85 |
| 2 | 44.99 | 0.89 |
| 3 | 45.02 | 0.86 |
| 4 | 45 | 0.91 |
| 5 | 45.04 | 0.87 |
| 6 | 44.98 | 0.9 |
| 7 | 44.91 | 0.86 |
| 8 | 45.04 | 0.89 |
| 9 | 45 | 0.85 |
| 10 | 44.97 | 0.91 |
| 11 | 45.11 | 0.84 |
| 12 | 44.96 | 0.87 |
| 13 | 45 | 0.86 |
| 14 | 44.92 | 0.89 |
| 15 | 45.06 | 0.87 |
| 16 | 44.94 | 0.86 |
| 17 | 45 | 0.85 |
| 18 | 45.03 | 0.88 |
| 45 | 0.872777778 |
Excel worksheet:
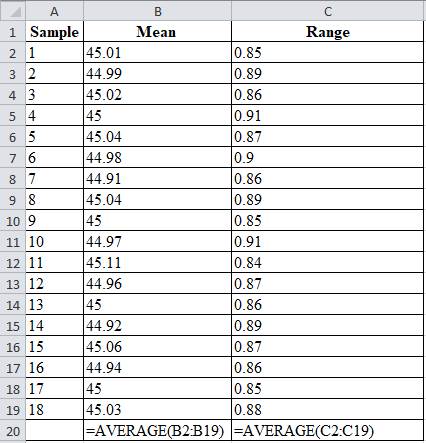
From factors of three-sigma chart, for n=20, A2 = 0.18; D3 = 0.41; D4 = 1.59
Mean control chart:
Range control chart:
Upper control limit:
The upper control limit is calculated by adding the product of 0.18 and 0.873 with 45, which yields 45.156.
Lower control limit:
The lower control limit is calculated by subtracting the product of 0.18 and 0.873 with 45, which yields 44.842.
A graph is plotted using the UCL, LCL and samples values.
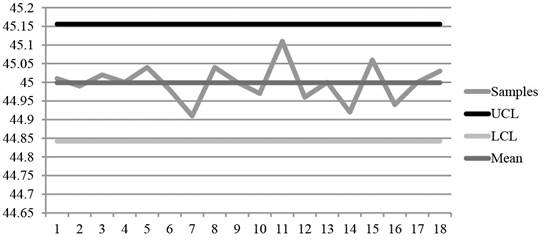
Diagram 1
Date set: 2
Table 5
| Sample | Mean | Range |
| 1 | 44.96 | 0.42 |
| 2 | 44.98 | 0.39 |
| 3 | 44.96 | 0.41 |
| 4 | 44.97 | 0.37 |
| 5 | 45.02 | 0.39 |
| 6 | 45.03 | 0.4 |
| 7 | 45.04 | 0.39 |
| 8 | 45.02 | 0.42 |
| 9 | 45.08 | 0.38 |
| 10 | 45.12 | 0.4 |
| 11 | 45.07 | 0.41 |
| 12 | 45.02 | 0.38 |
| 13 | 45.01 | 0.41 |
| 14 | 44.98 | 0.4 |
| 15 | 45 | 0.39 |
| 16 | 44.95 | 0.41 |
| 17 | 44.94 | 0.43 |
| 18 | 44.94 | 0.4 |
| 19 | 44.87 | 0.38 |
| 20 | 44.95 | 0.41 |
| 21 | 44.93 | 0.39 |
| 22 | 44.96 | 0.41 |
| 23 | 44.99 | 0.4 |
| 24 | 45 | 0.44 |
| 25 | 45.03 | 0.42 |
| 26 | 45.04 | 0.38 |
| 27 | 45.03 | 0.4 |
| 44.9959 | 0.40111 |
Excel worksheet:
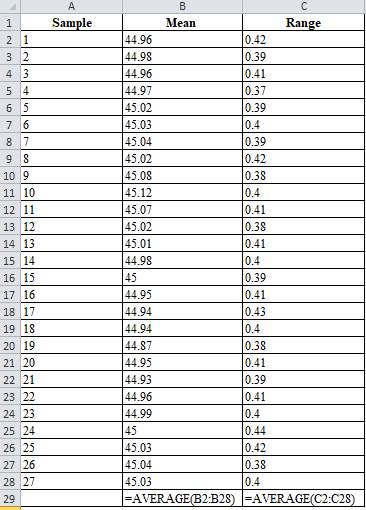
From factors of three-sigma chart, for n=20, A2 = 0.58
Mean control chart:
Range control chart:
Upper control limit:
The upper control limit is calculated by adding the product of 0.58 and 0.401 with 44.99, which yields 45.229.
Lower control limit:
The lower control limit is calculated by subtracting the product of 0.58 and 0.401 with 44.99, which yields 44.763.
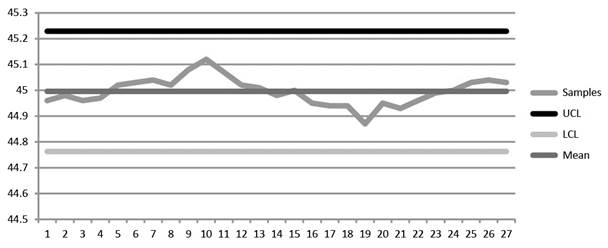
Diagram 2
On comparing Diagrams 1 and 2, it is evident that the second set of data has closer range of changes while the first set of data is scattered and reveals no information about the changes in the process.
Hence, the second sample reveals the changes in the process changes more clearly than the first set of data.
Want to see more full solutions like this?
Chapter 10 Solutions
Operations Management


- At Gleditsia Triacanthos Company, a certain manufactured part is deemed acceptable if its lengthis between 12.45 to 12.55 inches. The process is normally distributed with an average of 12.49inches and a standard deviation of 0.014 inches. A) Is the process capable of meeting specifications? B) Does the process meet specifications?arrow_forwardAuto pistons at Wemming Chung's plant in Shanghai are produced in a forging process, and the diameter is a critical factor that must be controlled. From sample sizes of 10 pistons produced each day, the mean and the range of this diameter have been as follows: a) What is the value of X? x= mm (round your response to two decimal places). Day 1 2 3 4 5 Mean x (mm) 158.9 155.2 155.6 157.5 156.6 Range R (mm) 4.2 4.4 4.3 4.8 4.3arrow_forwardA quality analyst wants to construct a sample mean chart for controlling a packaging process. Each day last week, he randomly selected four packages and weighed each. The raw data (in ounces) from that quality control activity appear below. Weight Day Package 1 Package 2 Package 3 Package 4 Monday 23 22 23 24 Tuesday 23 21 19 21 Wednesday 20 19 20 21 Thursday 18 19 20 19 Friday 18 20 22 20 What is the average of sample ranges in the random samples? Must compute each value in 2 dec pl.arrow_forward
- 24. Each of the processes listed is non-centered with respect to the specifications for that process. Compute the appropri ate capability index for each, and decide if the process is capable. Process Mean Standard Deviation Lower Spec Upper Spec H 15.0 0.32 14.1 16.0 K 33.0 1.00 30.0 36.5 18.5 0.40 16.5 20.1 25. An appliance manufacturer wants to contract with a repair shop to handle authorized repairs in Indianapolis. The company has set an acceptable range of repair time of 50 minutes to 90 minutes. Two firms have submitted bids for the work. In test trials, one firm had a mean repair time of 74 minutes with a standard deviation of 4.0 minutes and the other firm had a mean repair time of 72 minutes with a standard deviation of 5.1 minutes. Which firm would you choose? Why?arrow_forwardA process filling small bottles with baby formula hasa target of 3 ounces ± 0.150 ounce. Two hundred bottles fromthe process were sampled. The results showed the averageamount of formula placed in the bottles to be 3.042 ounces. Thestandard deviation of the amounts was 0.034 ounce. Determinethe value of Cpk· Roughly what proportion of bottles meetthe specifications?arrow_forwardUsing samples of 200 credit card statements, an auditor found the following: Sample 1 2 3 4 Number with errors 4 2 5 9 a. Determine the fraction defective in each sample. b. If the true fraction defective for this process is unknown, what is your estimate of it? c. What is your estimate of the mean and standard deviation of the sampling distribution of fractions defective for samples of this size? d. What control limits would give an alpha risk of .03 for this process? Page 457 e. What alpha risk would control limits of .047 and .003 provide? f. Using control limits of .047 and .003, is the process in control? g. Suppose that the long-term fraction defective of the process is known to be 2 percent. What are the values of the mean and standard deviation of the sampling distribution? h. Construct a control chart for the process, assuming a fraction defective of 2 percent, using two-sigma control limits. Is the process in control? Can you show me the steps and formulas using excelarrow_forward
- A quality analyst wants to construct a sample mean chart for controlling a packaging process. Each day last week, he randomly selected four packages and weighed each. The raw data (in ounces) from that quality control activity appear below. Weight Day Package 1 Package 2 Package 3 Package 4 Monday 23 22 23 24 Tuesday 23 21 19 21 Wednesday 20 19 20 21 Thursday 18 19 20 19 Friday 18 20 22 20 What is the mean of all sample means?arrow_forwardEagletrons are all-electric automobiles produced byMogul Motors, Inc. One of the concerns of Mogul Motors is thatthe Eagletrons be capable of achieving appropriate maximumspeeds. To monitor this, Mogul executives take samples of eight Eagletrons at a time. For each sample, they determine the aver-age maximum speed and the range of the maximum speeds within the sample. They repeat this with 35 samples to obtain 35 samplemeans and 35 ranges. They find that the average sample mean is88.50 miles per hour, and the average range is 3.25 miles per hour.Using these results, the executives decide to establish an R chart.They would like this chart to be established so that when it showsthat the range of a sample is not within the control limits, there isonly approximately a 0.0027 probability that this is due to naturalvariation. What will be the upper control limit (UCL) and thelower control limit (LCL) in this chart?arrow_forwardIn process industry during a daily production run, a total of five (05) samples are collected with four (04) observations within each sample. The sample means (X-bar) are; 14.09, 13.94,16.86, 20.00, and 16.64 respectively. The corresponding ranges are; 9.90, 7.73, 4.41, 7.56, and 3.49 respectively. The lower and upper control limits of the x-bar chart are respectively O a. 11.44, 20.66 O b. 11.29, 20.65 C. None is correct Od. 11.47, 21.14 e. 11.47, 16.55arrow_forward
- 1. The data shown in Table 1 are x and R values for 20 samples of size n= 5 taken from a process producing bearings. The measurements are made on the inside diameter of the bearing, with only the last three decimals recorded (i.e., 31.6 should be 0.50316). Please show all your work for full credit. (a) Set up x and R charts on this process. Does the process seem to be in statistical control? If necessary, revise the trial control limits. (b) Assume that diameter is normally distributed. Estimate the process standard deviation. Sample R Sample R 1 31.6 4 11 29.8 4 33.0 3 12 34.0 4 35.0 4 13 33.0 10 4 32.2 4 14 34.8 4 5 33.8 38.4 31.6 15 35.6 7 3 16 30.8 7 4 17 33.0 5 8 36.8 10 18 31.6 3 9. 35.0 15 19 28.2 9 10 34.0 6 20 33.8 Table 1: Bearing Diameter Dataarrow_forwardThe manager of the customer service department of Data Tech Credit Card Service Company is concerned about the number of defects produced by the billing process. Every day a random sample of 250 statements was inspected for errors regarding incorrect entries involving account numbers, transactions on the customer’s account, interest charges, and penalty charges. Any statement with one or more of these errors was considered a defect. The study lasted 30 days and yielded the data in Table. Sample Data For Data Tech Credit Card Service Samples Number of Errors in Sample of 250 1–10 3 8 5 11 7 1 12 9 0 8 11–20 3 5 7 9 11 3 2 9 13 4 21–30 12 10 6 2 1 7 10 5 8 4 a. Construct a p-chart for the billing process.b. Is there any nonrandom behavior in the billing process that would require management attention?arrow_forwardIn a fabric manufacturing factory, the quality control process using control charts from SPC. In an hour there are a total of 5 samples are taken each having 4 observations regarding the thickness of fabric in measured in millimeters. In a particular hour, the sample means (X-bar) are noted to be: 172.11, 219.58, 208.24, 112.44, and 123.30 respectively. In the same sample, the corresponding ranges are: 13.17, 13.38, 15.34, 13.04, and 13.02 respectively What are the lower and upper control limits for the X-bar chart? O a. None is correct O b. 143.55, 165.47 Oc. 144.78, 159.11 O d. 157.21, 177.05 O e. 146.01, 157.87 Of. 142.92, 160.66arrow_forward
 Practical Management ScienceOperations ManagementISBN:9781337406659Author:WINSTON, Wayne L.Publisher:Cengage,
 Operations ManagementOperations ManagementISBN:9781259667473Author:William J StevensonPublisher:McGraw-Hill Education
 Operations and Supply Chain Management (Mcgraw-hi...Operations ManagementISBN:9781259666100Author:F. Robert Jacobs, Richard B ChasePublisher:McGraw-Hill Education
 Purchasing and Supply Chain ManagementOperations ManagementISBN:9781285869681Author:Robert M. Monczka, Robert B. Handfield, Larry C. Giunipero, James L. PattersonPublisher:Cengage Learning
 Production and Operations Analysis, Seventh Editi...Operations ManagementISBN:9781478623069Author:Steven Nahmias, Tava Lennon OlsenPublisher:Waveland Press, Inc.