
Concept explainers
Videos
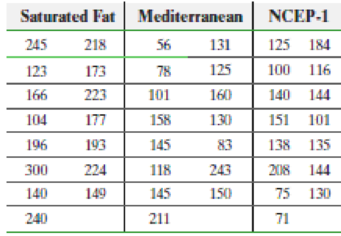
Lower Your Cholesterol Researcher Francisco Fuentes and his colleagues wanted to determine the most effective diet for reducing LDL cholesterol, the so-called “bad” cholesterol, among three diets: (1) a saturated-fat diet: 15% protein, 47% carbohydrates, and 38% fat (20% saturated fat, 12% monounsaturated fat, and 6% polyunsaturated fat); (2) the Mediterranean diet: 47% carbohydrates, and 38% fat (10% saturated fat, 22% monounsaturated fat, and 6% polyunsaturated fat); and (3) the US National Cholesterol Education Program or NCEP-1 Diet: 10% saturated fat, 12% monounsaturated fat, and 6% polyunsaturated fat. Participants in the study were shown to have the same levels of LDL cholesterol before the study and were randomly assigned to one of the three diets, or treatment groups. After 28 days, their LDL cholesterol levels were recorded. The data in the following table are based on this study.
- (a) Why is this study a completely randomized design?
- (b) What is the response variable? What is the explanatory variable that is controlled and set at three levels?
- (c) The participants were randomly assigned to one of three treatment groups. What is the purpose of randomization in this study?
- (d) State the null and alternative hypotheses.
- (e) Verify that the requirements to use the one-way ANOVA procedure are satisfied. Normal probability plots indicate that the sample data come from normal populations.
- (f) Are the mean LDL cholesterol levels different at the α = 0.05 level of significance?
- (g) Draw boxplots of the LDL cholesterol levels for the three groups to support the analytic results obtained in part (f).

Learn your wayIncludes step-by-step video

Chapter B.6 Solutions
Fundamentals of Statistics (5th Edition)
Additional Math Textbook Solutions
Elementary Statistics: Picturing the World (7th Edition)
Statistics: The Art and Science of Learning from Data (4th Edition)
Elementary Statistics (13th Edition)
Introductory Statistics (2nd Edition)
Statistics for Psychology
An Introduction to Mathematical Statistics and Its Applications (6th Edition)


- Cholesterol Cholesterol in human blood is necessary, but too much can lead to health problems. There are three main types of cholesterol: HDL (high-density lipoproteins), LDL (low-density lipoproteins), and VLDL (very low-density lipoproteins). HDL is considered “good” cholesterol; LDL and VLDL are considered “bad” cholesterol. A standard fasting cholesterol blood test measures total cholesterol, HDL cholesterol, and triglycerides. These numbers are used to estimate LDL and VLDL, which are difficult to measure directly. Your doctor recommends that your combined LDL/VLDL cholesterol level be less than 130 milligrams per deciliter, your HDL cholesterol level be at least 60 milligrams per deciliter, and your total cholesterol level be no more than 200 milligrams per deciliter. (a) Write a system of linear inequalities for the recommended cholesterol levels. Let x represent the HDL cholesterol level, and let y represent the combined LDL VLDL cholesterol level. (b) Graph the system of inequalities from part (a). Label any vertices of the solution region. (c) Is the following set of cholesterol levels within the recommendations? Explain. LDL/VLDL: 120 milligrams per deciliter HDL: 90 milligrams per deciliter Total: 210 milligrams per deciliter (d) Give an example of cholesterol levels in which the LDL/VLDL cholesterol level is too high but the HDL cholesterol level is acceptable. (e) Another recommendation is that the ratio of total cholesterol to HDL cholesterol be less than 4 (that is, less than 4 to 1). Identify a point in the solution region from part (b) that meets this recommendation, and explain why it meets the recommendation.arrow_forwardCellulon, a manufacturer of home insulation, wants to develop guidelines for builders and consumers on how the thickness of the insulation in the attic of a home and the outdoor temperature affect natural gas consumption. In the laboratory, it varied the insulation thickness and temperature. A few of the findings are:arrow_forwardThe concentration of cholesterol (a type of fat) in the blood is associated with the risk of developing heart disease, such that higher concentrations of cholesterol indicate a higher level of risk, and lower concentrations indicate a lower level of risk. If you lower the concentration of cholesterol in the blood, your risk of developing heart disease can be reduced. Being overweight and/or physically inactive increases the concentration of cholesterol in your blood. Both exercise and weight loss can reduce cholesterol concentration. However, it is not known whether exercise or weight loss is best for lowering cholesterol concentration. Therefore, a researcher decided to investigate whether an exercise or weight loss intervention is more effective in lowering cholesterol levels. To this end, the researcher recruited a random sample of inactive males that were classified as overweight. This sample was then randomly split into two groups: Group 1 underwent a calorie-controlled diet and…arrow_forward
- An experimenter wants to study the relationship between type of milk and infant growth in underdeveloped countries. She randomly assigns 300 infants to either a breast-feeding group or an infant formula group. She then weighs the infants every three days for the first four weeks of life.arrow_forwardYou get a job as the manager of a popular ice cream store in your hometown. One of your first concerns is determining how much ice cream you should stock to meet the demands of your customers. You suspect that the number of customers buying ice cream probably depends on several factors. In looking through company files, you discover that the former manager collected considerable data. Last summer, a typical week produced the following data: Day Temperature (degrees Fahrenheit) Number of Transactions Gross Receipts (in dollars) Monday 78 238 3014 Tuesday 73 194 2842 Wednesday 70 172 2141 Thursday 75 185 2235 Friday 83 270 4505 Saturday 89 320 5021 Sunday 94 280 4442 On the graph below, the temperature is graphed on the x axis and the number of transactions is graphed on the y axis. Investigate the relationship between the temperature and the gross receipts. On the grid below, graph…arrow_forwardA manufacturing company is analyzing its accident record. The accidents fall into two categories: Minor—dealt with by first aider: Average cost k50 Major—hospital required. Average cost k1,000 The company has 1,000 employees, of which 180 are office staff and the rest work in the factory. The analysis shows that 10% of employees have an accident each year and 20% of accidents are major. It is assumed that an employee has more than one accident in a year. (i) Determine the expected total cost of accidents in a year. [] On further analysis it is discovered that a member of office staff has half the probability of having an accident relative those in the factory. (ii) Show that the probability that a given a member of office staff has an accident in a year is 0.0549. (iii) Determine the probability that a randomly chosen employee who has had an accident is office staff.arrow_forward
- What does the fish population of the lake approach in the long run?arrow_forwardAt the grocery store, 70% of the different types of juice come in a bottle holding at least 400 milliliters (mL) and 40% of the different types of juice come in a low-sugar version. Only 25% of the juice varieties are in bottles holding at least 400 mL and have a low-sugar version. What percentage of the different types of juice come in a bottle holding at least 400 mL or are low-sugar? Explain your reasoning.arrow_forwardSome commercial airlines recirculate about half the air in the cabin during flights as a way to improve fuel efficiency. Other airlines make a policy of NOT recirculating the air and instead, have fresh air from the atmosphere constantly being inserted into the cabin with the “old” air being pumped out of the plane. A total of 1100 passengers flying from San Francisco to Denver were used for an experiment. After their flight, they were each given a list of symptoms associated with the common cold. They were asked to report if they experienced cold symptoms within 24 hours of the flight landing. Of the 517 passengers who flew on planes that recirculate the air, 108 reported post-flight cold symptoms. Of the 583 passengers who flew on airlines that do not use recirculation in the cabin, 110 reported symptoms. Suppose now that we want to use the recirculation of air data to explore “Goal #2”, which is to resolve a hypothesis test about . a) If we want to resolve this hypothesis…arrow_forward
- An analyst in the real estate business is interested in the relationship between the cost of the monthly rent of an apartment and the size of an apartment, in big cities. She gathers data for apartment buildings in 12 cities in 12 different states. In each city, she gets the numbers for at least 5 different buildings and at least 40 apartments in each building. She reaches the following conclusion: the rental cost of a 2-bedroom apartment is 50% more than the rental cost of a 1-bedroom apartment, and the rental cost of a 3-bedroom apartment is 50% more than the rental cost of a 2-bedroom apartment. Based on the paragraph, what is the minimum number of apartments she collected data on? Do you think her sample was large enough to be statistically valid? Based on the paragraph, are there any apartments or apartment buildings that she would have excluded from her study? Do you see any bias in how she selected apartments for her study? Based on the paragraph, is there a positive…arrow_forwardHow profitable are different sectors of the stock market? One way to answer such a question is to examine profit as a percentage of stockholder equity. A random sample of 32 retail stocks was studied for x1, profit as a percentage of stockholder equity. The result was x1 = 13.2. A random sample of 33 utility (gas and electric) stocks was studied for x2, profit as a percentage of stockholder equity. The result was x2 = 10.0. Assume ?1 = 4.2 and ?2 = 2.6. Note: For degrees of freedom d.f. not in the Student's t table, use the closest d.f. that is smaller. In some cases, this choice will increase the P-value by a small amount or increase the length of the confidence interval, thereby making the answer slightly more "conservative." (a) Let ?1 represent the population mean profit as a percentage of stockholder equity for retail stocks, and let ?2 represent the population mean profit as a percentage of stockholder equity for utility stocks. Find a 95% confidence interval for ?1 − ?2.…arrow_forwardRoss White recently opened a landscaping division , that advises home owners and businesses on landscaping and lawn maintenance. The operations manager, Ms. Priya Johnson, is trying to determine the amount of fertilizer that should be applied to a particular lawn in a residential area in San Juan. Ms. Johnson’s analysis has determined that the lawn needs at least 60kg of Nitrogen, 24kg of Phosphorous compounds and 40kg of Potassium compounds for the current season. After checking nearby home and garden centres, Ms. Johnson has found that one of the suppliers is currently having a sale on packaged fertilizer. One type on sale called Xynis, is a 20-5-20 mixture, containing 20% Nitrogen, 5% phosphorous compounds and 20% potassium compounds. It sells at $4 for a 20kg bag. The other type called Yield-all is a 10-10-5 mixture (10% Nitrogen, 10% phosphorous compounds and 5% potassium compounds) selling for $5 for a 40kg bag. Ms. Johnson would like to know how many bags of each type she…arrow_forward
