
Modern Business Statistics with Microsoft Office Excel (with XLSTAT Education Edition Printed Access Card) (MindTap Course List)
6th Edition
ISBN: 9781337115186
Author: David R. Anderson, Dennis J. Sweeney, Thomas A. Williams, Jeffrey D. Camm, James J. Cochran
Publisher: Cengage Learning
expand_more
expand_more
format_list_bulleted
Concept explainers
Videos
Textbook Question
Chapter 16.1, Problem 1E
Consider the following data for two variables, x and y.
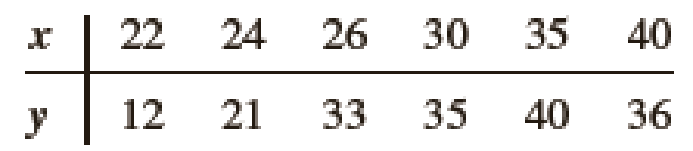
- a. Develop an estimated regression equation for the data of the form
- b. Using the results from part (a), test for a significant relationship between x and y; use α = .05.
- c. Develop a
scatter diagram for the data. Does the scatter diagram suggest an estimated regression equation of the form - d. Develop an estimated regression equation for the data of the form
- e. Refer to part (d). Is the relationship between x, x2, and y significant? Use α = .05.
- f. Predict the value of y when x = 25.
Expert Solution & Answer
Want to see the full answer?
Check out a sample textbook solution
Students have asked these similar questions
create graph of the two-variable data with a regression line, r, r2, and separate residual plot
The following table gives the data for the average temperature and the snow accumulation in several small towns for a single month. Determine the equation of the regression line, yˆ=b0+b1xy^=b0+b1x. Round the slope and y-intercept to the nearest thousandth. Then determine if the regression equation is appropriate for making predictions at the 0.01 level of significance.
Average Temperatures and Snow Accumulations
Average Temperature (℉℉)
45
34
24
45
39
20
31
19
35
44
Snow Accumulation (in.in.)
9
16
24
9
15
28
25
18
16
5
1. Regression equation: y=__________
2. Is the equation appropriate? yes or no
The following table gives the data for the average temperature and the snow accumulation in several small towns for a single month. Determine the equation of the regression line, yˆ=b0+b1xy^=b0+b1x. Round the slope and y-intercept to the nearest thousandth. Then determine if the regression equation is appropriate for making predictions at the 0.010.01 level of significance.
Average Temperatures and Snow Accumulations
Average Temperature (℉℉)
38
30
17
39
45
22
34
24
29
38
Snow Accumulation (in.in.)
6
19
27
5
13
26
26
14
13
5
Copy Data
Chapter 16 Solutions
Modern Business Statistics with Microsoft Office Excel (with XLSTAT Education Edition Printed Access Card) (MindTap Course List)
Ch. 16.1 - Consider the following data for two variables, x...Ch. 16.1 - Consider the following data for two variables, x...Ch. 16.1 - Prob. 3ECh. 16.1 - A highway department is studying the relationship...Ch. 16.1 - In working further with the problem of exercise 4,...Ch. 16.1 - A study of emergency service facilities...Ch. 16.1 - Home Depot, a nationwide home improvement...Ch. 16.1 - Corvette, Ferrari, and Jaguar produced a variety...Ch. 16.1 - The film Suicide Squad has an average rating of...Ch. 16.2 - In a regression analysis involving 27...
Ch. 16.2 - Prob. 11ECh. 16.2 - The Professional Golfers’ Association of America...Ch. 16.2 - Refer to exercise 12.
Develop an estimated...Ch. 16.2 - A 10-year study conducted by the American Heart...Ch. 16.2 - The average monthly residential gas bill for Black...Ch. 16.5 - Prob. 16ECh. 16.5 - Prob. 17ECh. 16.5 - Prob. 18ECh. 16.5 - Prob. 19ECh. 16.5 - Prob. 20ECh. 16.5 - Prob. 21ECh. 16.5 - Prob. 22ECh. 16.5 - Prob. 23ECh. 16.6 - The following data show the daily closing prices...Ch. 16.6 - Refer to the Cravens data set in Table 16.5. In...Ch. 16 - A sample containing years to maturity and yield...Ch. 16 - Consumer Reports tested 19 different brands and...Ch. 16 - A study investigated the relationship between...Ch. 16 - Refer to the data in exercise 28. Consider a model...Ch. 16 - Refer to the data in exercise 28.
Develop an...Ch. 16 - Prob. 31SECh. 16 - The Ladies Professional Golf Association (LPGA)...Ch. 16 - Wine Spectator magazine contains articles and...
Knowledge Booster


Learn more about
Need a deep-dive on the concept behind this application? Look no further. Learn more about this topic, statistics and related others by exploring similar questions and additional content below.Similar questions
- Find the equation of the regression line for the following data set. x 1 2 3 y 0 3 4arrow_forwardIf your graphing calculator is capable of computing a least-squares sinusoidal regression model, use it to find a second model for the data. Graph this new equation along with your first model. How do they compare?arrow_forwardDoes Table 1 represent a linear function? If so, finda linear equation that models the data.arrow_forward
- Respiratory Rate Researchers have found that the 95 th percentile the value at which 95% of the data are at or below for respiratory rates in breath per minute during the first 3 years of infancy are given by y=101.82411-0.0125995x+0.00013401x2 for awake infants and y=101.72858-0.0139928x+0.00017646x2 for sleeping infants, where x is the age in months. Source: Pediatrics. a. What is the domain for each function? b. For each respiratory rate, is the rate decreasing or increasing over the first 3 years of life? Hint: Is the graph of the quadratic in the exponent opening upward or downward? Where is the vertex? c. Verify your answer to part b using a graphing calculator. d. For a 1- year-old infant in the 95 th percentile, how much higher is the walking respiratory rate then the sleeping respiratory rate? e. f.arrow_forwardWhat is regression analysis? Describe the process of performing regression analysis on a graphing utility.arrow_forwardA study was conducted to see if birth weight affects the increase in weight of a newborn betweendays 70 and 100 of life. The study recorded the birth weight (in ounces) (X) for 12 newborns and thenfollowed up to record the increase in weight between days 70 and 100, and expressed it as the percentageof the birth weight (Y). The regression line between the two variables was found to beIncrease (% of birth weight) = 256.3 −1.74 × birth weight Note: The symbol above is a stretched hat symbol to indicate ˆy. (a) Is the direction of relationship between the two variables positive or negative? What does this meanin context of the problem.(b) Interpret the slope of the regression line in context of the problem.(c) Find the predicted increase in birth weight between days 70 and 100 for a baby that weighed 95ounces at birth.arrow_forward
- A 10-year study conducted by the American Heart Association provided data on how age, blood pressure, and smoking related to the risk of strokes. The data file “Stroke.xslx” includes a portion of the data from the study. The variable “Risk of Stroke” is measured as the percentage of risk (proportion times 100) that a person will have a stroke over the next 10-year period. Regression Analysis As Image: 1) Based on the simple regression analysis output, write the estimated regression equation. 2) What is the correlation coefficient between Risk of Stroke and Age? How do you find iarrow_forwardAn independent researcher wants to investigate if the factors which determine the house rent (Y, measured in dollars), such as the distance of the house from the airport (X,), the time since the house was built (X,), are significant or not. He collects data from 280 prospective locations and estimates the following regression equation: Y = 2.5 -0.88X, +1.98X2. (0.98) (2.14) The 95% confidence interval for the slope coefficient B,, keeping the other variables constant will be (Round your answer to two decimal places. Enter a minus sign if your answer is negative.) owe ppe Based on the calculated confidence intervals, we can say that at the 5% significance level, we will V the hypothesis B, = 0. The 99% confidence interval for the slope coefficient B,, keeping the other variables constant will be (. 1.04 (Round your answer to two decimal places. Enter a minus sign if your answer is negative.) Based on the calculated confidence intervals, we can say that at the 1% significance level, we…arrow_forward
arrow_back_ios
arrow_forward_ios
Recommended textbooks for you
 Glencoe Algebra 1, Student Edition, 9780079039897...AlgebraISBN:9780079039897Author:CarterPublisher:McGraw Hill
 Algebra & Trigonometry with Analytic GeometryAlgebraISBN:9781133382119Author:SwokowskiPublisher:Cengage
 Calculus For The Life SciencesCalculusISBN:9780321964038Author:GREENWELL, Raymond N., RITCHEY, Nathan P., Lial, Margaret L.Publisher:Pearson Addison Wesley,
 Trigonometry (MindTap Course List)TrigonometryISBN:9781305652224Author:Charles P. McKeague, Mark D. TurnerPublisher:Cengage Learning
 Algebra and Trigonometry (MindTap Course List)AlgebraISBN:9781305071742Author:James Stewart, Lothar Redlin, Saleem WatsonPublisher:Cengage Learning
Glencoe Algebra 1, Student Edition, 9780079039897...
Algebra
ISBN:9780079039897
Author:Carter
Publisher:McGraw Hill
Algebra & Trigonometry with Analytic Geometry
Algebra
ISBN:9781133382119
Author:Swokowski
Publisher:Cengage
Calculus For The Life Sciences
Calculus
ISBN:9780321964038
Author:GREENWELL, Raymond N., RITCHEY, Nathan P., Lial, Margaret L.
Publisher:Pearson Addison Wesley,
Trigonometry (MindTap Course List)
Trigonometry
ISBN:9781305652224
Author:Charles P. McKeague, Mark D. Turner
Publisher:Cengage Learning
Algebra and Trigonometry (MindTap Course List)
Algebra
ISBN:9781305071742
Author:James Stewart, Lothar Redlin, Saleem Watson
Publisher:Cengage Learning
Correlation Vs Regression: Difference Between them with definition & Comparison Chart; Author: Key Differences;https://www.youtube.com/watch?v=Ou2QGSJVd0U;License: Standard YouTube License, CC-BY
Correlation and Regression: Concepts with Illustrative examples; Author: LEARN & APPLY : Lean and Six Sigma;https://www.youtube.com/watch?v=xTpHD5WLuoA;License: Standard YouTube License, CC-BY