1. In the system in Figure E.1, x,(t) = sinc(t), fc = 10 and the cutoff frequency of the lowpass filter is 1 Hz. Graph the signals x, (t), y,(t), ya(t) and yf(t) and the magnitudes and phases of their CTFTS. y,(1) = x,(1) Ya(t) x,(1) LPF cos(2f1) cos(21ft)
1. In the system in Figure E.1, x,(t) = sinc(t), fc = 10 and the cutoff frequency of the lowpass filter is 1 Hz. Graph the signals x, (t), y,(t), ya(t) and yf(t) and the magnitudes and phases of their CTFTS. y,(1) = x,(1) Ya(t) x,(1) LPF cos(2f1) cos(21ft)

Electricity for Refrigeration, Heating, and Air Conditioning (MindTap Course List)
10th Edition
ISBN:9781337399128
Author:Russell E. Smith
Publisher:Russell E. Smith
Chapter17: Commercial And Industrial Air-conditioning Control Systems
Section: Chapter Questions
Problem 25RQ

Related questions

Question
Signals and systems
Please solve for problem. 7 only
Based on the problem 1.

Transcribed Image Text:1. In the system in Figure E.1, x,(t) = sinc(t), fe
the lowpass filter is 1 Hz. Graph the signals x, (t), y,(t), ya(t) and yƒ(t) and the
magnitudes and phases of their CTFTS.
= 10 and the cutoff frequency of
y,(1) = x,(1)
Ya(1)
x,(1)
- y,(1)
LPF
cos(2nfct)
cos(2tft)
Figure E.1

Transcribed Image Text:Chapter 12 Communication System Analysis
EXERCISES WITHOUT ANSWERS
Amplitude Modulation
7. Repeat Exercise 1 but with the second cos(2Tfet) replaced by sin(2ifct).
Expert Solution
Step 1
Given the system a shown below:
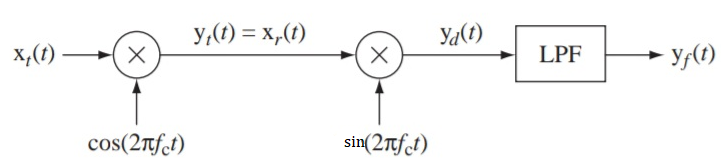
xt(t)=sinc(t), fc=10 and the cut-off frequency of the low-pass filter is 1 Hz. We need to plot the signals xt(t) , yt(t), yd(t) and yf(t) and the magnitudes and phases of their CTFT's.

Step by step
Solved in 3 steps with 5 images

Knowledge Booster


Learn more about
Need a deep-dive on the concept behind this application? Look no further. Learn more about this topic, electrical-engineering and related others by exploring similar questions and additional content below.Recommended textbooks for you
Electricity for Refrigeration, Heating, and Air C…
Mechanical Engineering
ISBN:
9781337399128
Author:
Russell E. Smith
Publisher:
Cengage Learning
Electricity for Refrigeration, Heating, and Air C…
Mechanical Engineering
ISBN:
9781337399128
Author:
Russell E. Smith
Publisher:
Cengage Learning