Exercise #1: n = 30 observations X Y 52 62 47 68 38 17 བdཆེར Y X Y 43 43 44 46 ཆེར 79 81 39 43 47 86 69 78 55 52 57 60 44 46 38 68 71 91 52 55 50 54 67 62 66 80 63 65 47 52 68 78 70 71 45 56 42 16 28 72 62 47 41 64 70 69 71 68 78 37 55 1. Compute the value of the sample correlation between variables X & Y; denoted by r Note: r = SXY √√Sxx x Syy 2. Test - Use Excel to compute these S's like I have done in previous homework assignments HA: (μx μy) 0 at α = 5% using the p value Method a. Assuming independent populations (i.e., disregarding the correlation) b. Using Match Pairs Technique
Exercise #1: n = 30 observations X Y 52 62 47 68 38 17 བdཆེར Y X Y 43 43 44 46 ཆེར 79 81 39 43 47 86 69 78 55 52 57 60 44 46 38 68 71 91 52 55 50 54 67 62 66 80 63 65 47 52 68 78 70 71 45 56 42 16 28 72 62 47 41 64 70 69 71 68 78 37 55 1. Compute the value of the sample correlation between variables X & Y; denoted by r Note: r = SXY √√Sxx x Syy 2. Test - Use Excel to compute these S's like I have done in previous homework assignments HA: (μx μy) 0 at α = 5% using the p value Method a. Assuming independent populations (i.e., disregarding the correlation) b. Using Match Pairs Technique

Glencoe Algebra 1, Student Edition, 9780079039897, 0079039898, 2018
18th Edition
ISBN:9780079039897
Author:Carter
Publisher:Carter
Chapter10: Statistics
Section10.1: Measures Of Center
Problem 9PPS

Related questions
Question
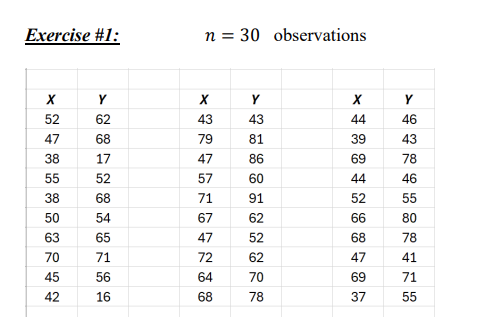
Transcribed Image Text:Exercise #1:
n = 30 observations
X
Y
52
62
47
68
38
17
བdཆེར
Y
X
Y
43
43
44
46
ཆེར
79
81
39
43
47
86
69
78
55
52
57
60
44
46
38
68
71
91
52
55
50
54
67
62
66
80
63
65
47
52
68
78
70
71
45
56
42
16
28
72
62
47
41
64
70
69
71
68
78
37
55
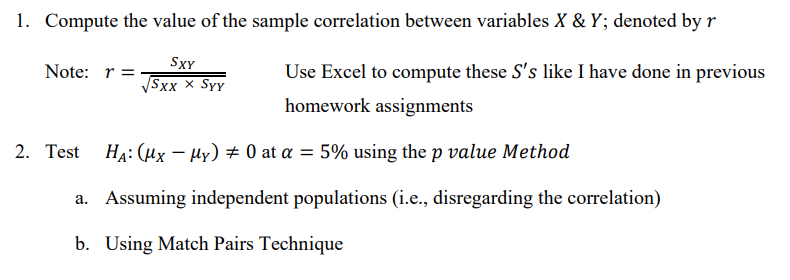
Transcribed Image Text:1. Compute the value of the sample correlation between variables X & Y; denoted by r
Note: r =
SXY
√√Sxx x Syy
2. Test
-
Use Excel to compute these S's like I have done in previous
homework assignments
HA: (μx μy) 0 at α = 5% using the p value Method
a. Assuming independent populations (i.e., disregarding the correlation)
b. Using Match Pairs Technique
Expert Solution
This question has been solved!
Explore an expertly crafted, step-by-step solution for a thorough understanding of key concepts.

This is a popular solution!

Trending now
This is a popular solution!

Step by step
Solved in 2 steps

Recommended textbooks for you
Glencoe Algebra 1, Student Edition, 9780079039897…
Algebra
ISBN:
9780079039897
Author:
Carter
Publisher:
McGraw Hill
Glencoe Algebra 1, Student Edition, 9780079039897…
Algebra
ISBN:
9780079039897
Author:
Carter
Publisher:
McGraw Hill